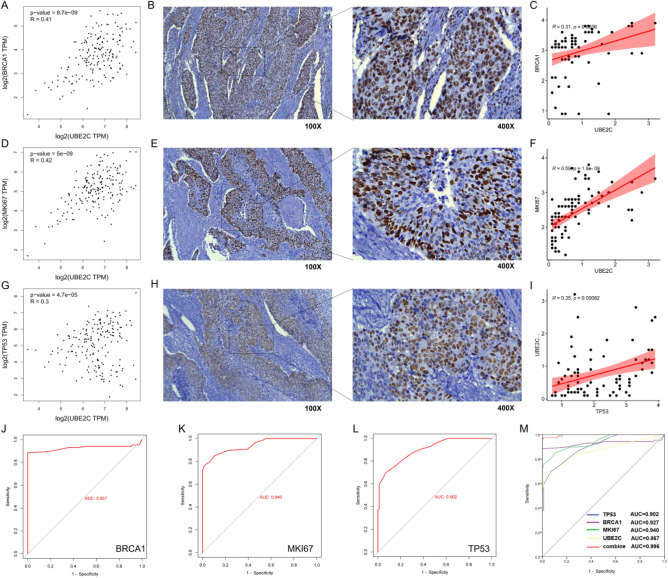
Figure 12.
Correlation analysis between UBE2C and clinical markers and evaluation of combined diagnostic effect. (A, D, G) The correlation between UBE2C and clinical markers (BRCA1, KI67 and TP53) in esophageal cancer was analyzed by GEPIA database. R represents the correlation coefficient. (B, E, H) Expression of clinical markers (BRCA1, KI67 and TP53) in esophageal cancer. The brown part represents the target protein. (C, F, I) The correlation between UBE2C and clinical markers (BRCA1, KI67 and TP53) was analyzed according to the results of clinical immunohistochemistry. (J-L) ROC curve was used to analyze the diagnostic efficacy of clinical markers (BRCA1, KI67 and TP53) in esophageal cancer. (M) Efficacy of UBE2C combined with clinical markers (BRCA1, KI67 and TP53) in the diagnosis of esophageal cancer.

