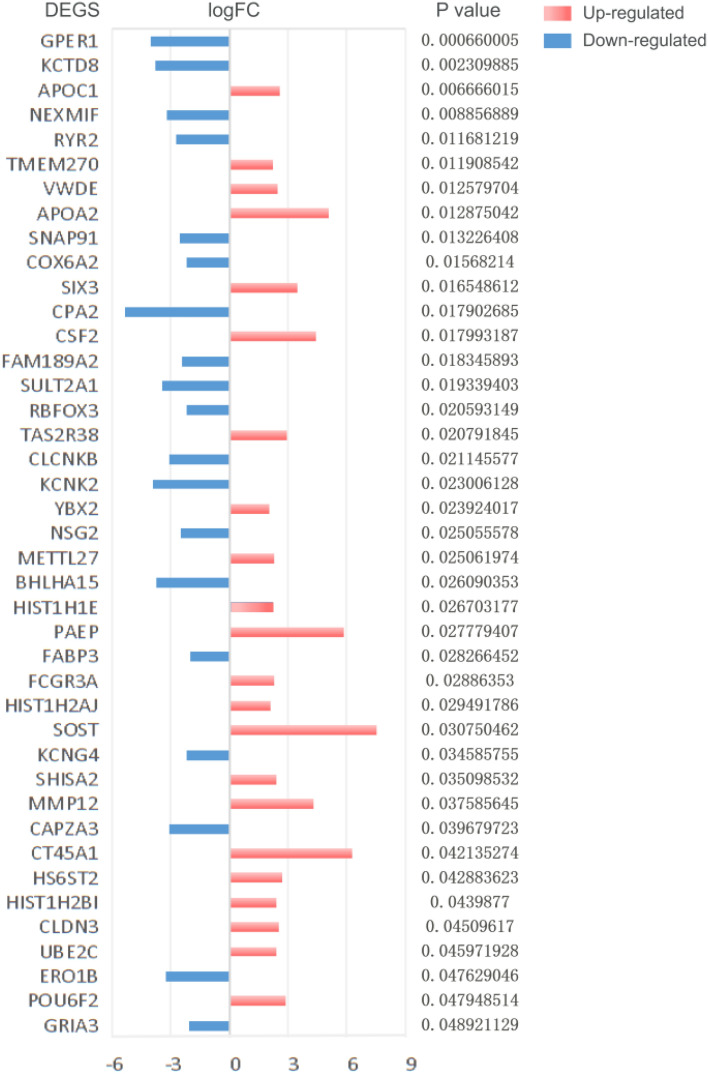
Figure 2.
Up and down regulation of prognostically related DEGs in esophageal cancer. The red bar represents the up regulation of gene expression, the blue bar represents the down regulation of gene expression, and the length of the bar represents the value of |logFC|. The prognostic p value was shown on the right side of the gene.Up-regulated:APOC1,TMEM270,VWDE,APOA2,SIX3,CSF2,TAS2R38,YBX2,METTL27,PAEP,HIST1H2AJ,SOST,SHISA2,MMP12,CT45A1,HS6ST2,HIST1H2BI,CLDN3,UBE2C,POU6F2. Down-regulated:GPER1,KCTD8,NEXMIF,RYR2,SNAP91,COX6A2,CPA2,FAM189A2,SULT2A1,RBFOX3,CLCNKB,KCNK2,NSG2,BHLHA15,FABP3,KCNG4,CAPZA3,ERO1B,GRIA3.

