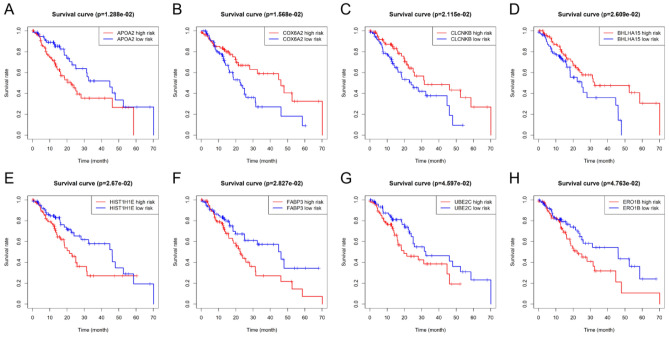
Figure 6.
Kaplan–Meier (KM) survival curves of the EC patients with low or high individual risk score of eight genes. (A) Survival curve of APOA2. (B) Survival curve of COX6A2. (C) Survival curve of CLCNKB. (D) Survival curve of BHLHA15. (E) Survival curve of HIST1H1E. (F) Survival curve of FABP3. (G) Survival curve of UBE2C. (H) Survival curve of ERO1B. The red line represents the high-risk group and the blue line represents the low-risk group.

