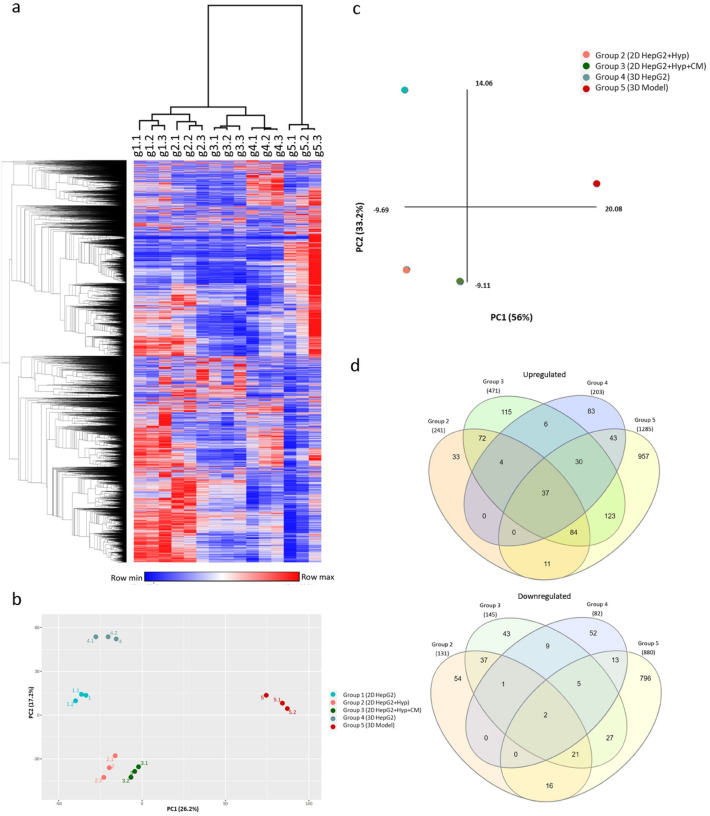
Figure 2.
Computational analysis of the RNA-Seq of our group cohorts. (a) Hierarchical clustering heatmap of global expression in all groups (in triplicates) was generated with Morpheus using default settings. (b) PCA plot based on global expression in all groups (in triplicates) was generated using NetworkAnalyst (c) PCA plot based on significant DEGs of group 2,3,4,5 in comparison to group 1. (d) Venn diagrams showing the common and unique upregulated genes and downregulated genes of groups 2, 3, 4, and 5. The interactive diagrams can be accessed online using the InteractiVenn (http://www.interactivenn.net) and supporting files 1 and 2.

