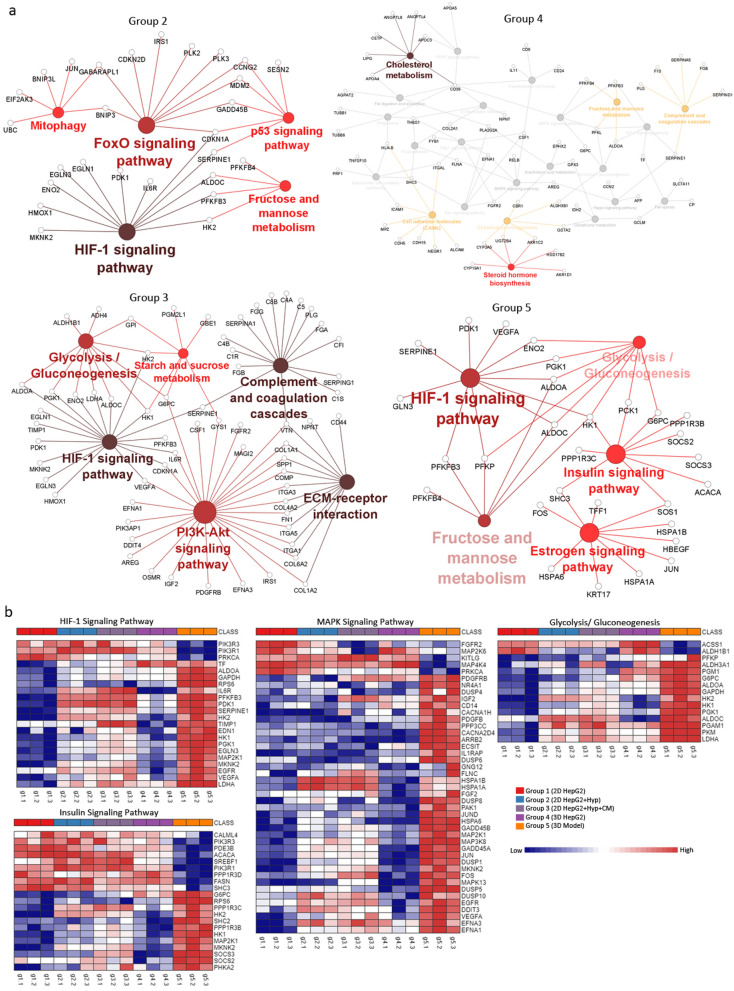
Figure 3.
Pathway clustering analysis and heatmap representation of experimental groups. (a) Pathway term clustering based on KEGG pathway maps based on DEGs of experimental groups32–34. All groups are compared to G1 as the control condition. Node size of pathway terms resemble the number of associated genes to it. The stronger the node color the more significant a cluster is. (b) ORA heatmaps of enriched genes in denoted pathways based on KEGG from all groups32–34. Heatmaps were generated using NetworkAnalyst.

