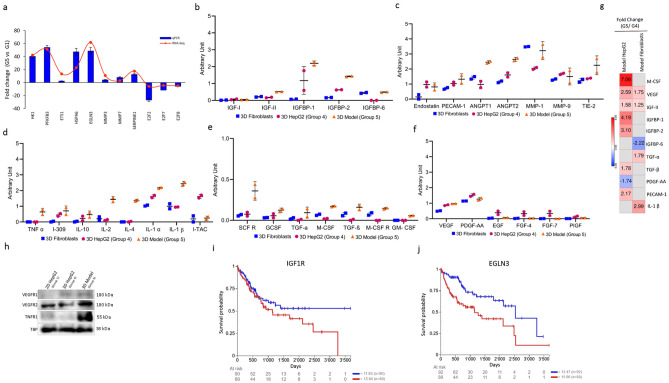
Figure 4.
Confirmation studies using genomic, proteomic, and clinical analyses. (a) Validation by qPCR. RNA-Seq based expression was plotted against qPCR-based expression. qPCR data are represented as means of fold change ± SD. (b–f) levels of different secreted factors in 3D mono- and co-cultures analyzed by antibody arrays. Experimental scheme is outlined in Fig. S2 (g) fold change of expression of HepG2 and Fibroblasts before and after co-culture for markers shown in panels (b–f) based on RNA-seq data. (h) western blotting of total cell lysates of 2D or 3D HepG2 cultures. Uncropped blots are shown in Fig. S3. (i,j) Kaplan–Meier overall survival analysis in LIHC patients upon IGF1R and EGLN3 expression. Log-rank test calculated p-value from upper and lower quartile comparisons and gene expression of GDC TCGA LIHC primary tumor samples is presented (n = 179).

