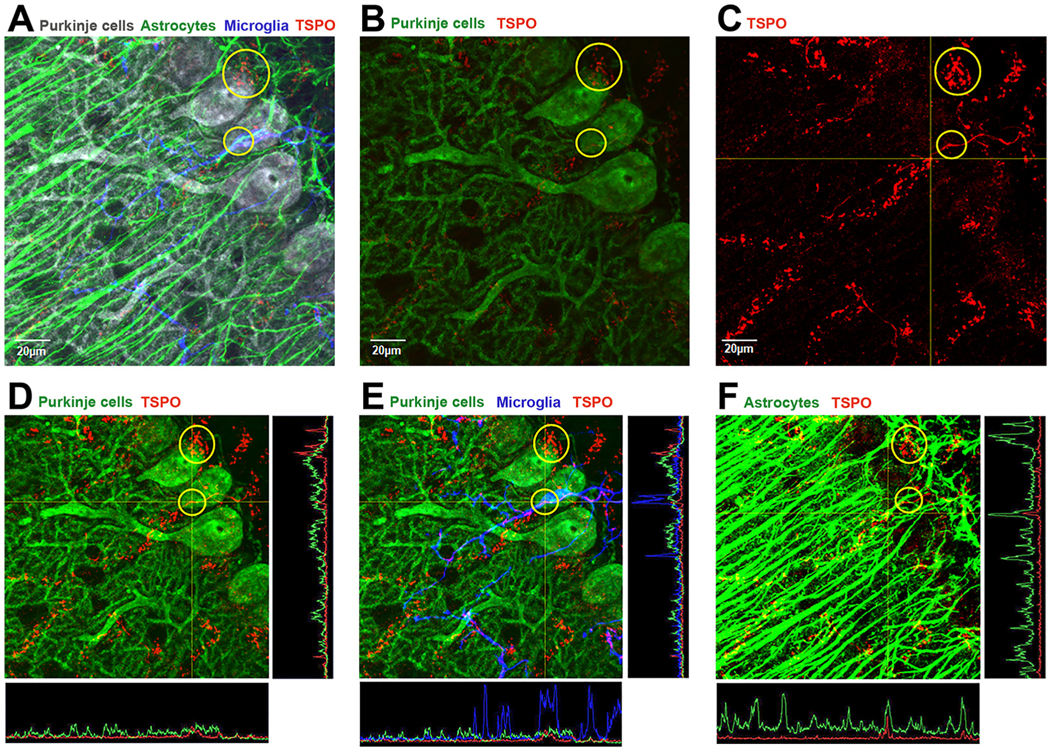
Fig. 3.

TSPO expression in the Purkinje cell layer of the cerebellum.
A) Quadruple immunofluorescence confocal imaging represented in a top-down view of a 3D condensed z-stack of Purkinje cells (calbindin-gray color), Bergmann glia(GFAP-green color), microglia (Iba1-blue color) and TSPO (red color). The image shows the complex network of glial processes and cell bodies intimately touching the Purkinje cell soma and processes. B) Same image as panel A but the Bergmann glia and microglia channels are not presented to show the relationship of TSPO (red) with Purkinje cells (calbindin-green). Based on this view, in the yellow circles it appears that TSPO may be localized in Purkinje cells. C) In this image, only the TSPO signal is presented and enhanced to be able to visualize since TSPO levels are low in the normal brain [see LUT settings in supplementary Fig. 1]. D) This image again shows the Purkinje cell (calbindin-green) and TSPO (red) but in this image both signals are enhanced [see LUT settings in supplementary Fig. 1]. With signal enhancement one can see a perceived colocalization of TSPO with the Purkinje cell. However, analysis of the TSPO and Purkinje cell signals in the yellow circle using line intensity profiles indicates they do not colocalize as the peaks do not correspond with each other. E) The image provided is the same as D, but the microglia (blue – Iba1) signal is also added. One can see based on the intensity profile that TSPO colocalizes with microglia and not with the Purkinje cell. F) This image represents GFAP (green) staining of Bergmann glia process which in different areas colocalize with TSPO (red) generating a yellow color. Intensity profiles indicate that TSPO (red) colocalizes with Bergmann glia processes (green). (For interpretation of the references to colour in this figure legend, the reader is referred to the web version of this article.)
