Fig. 4.

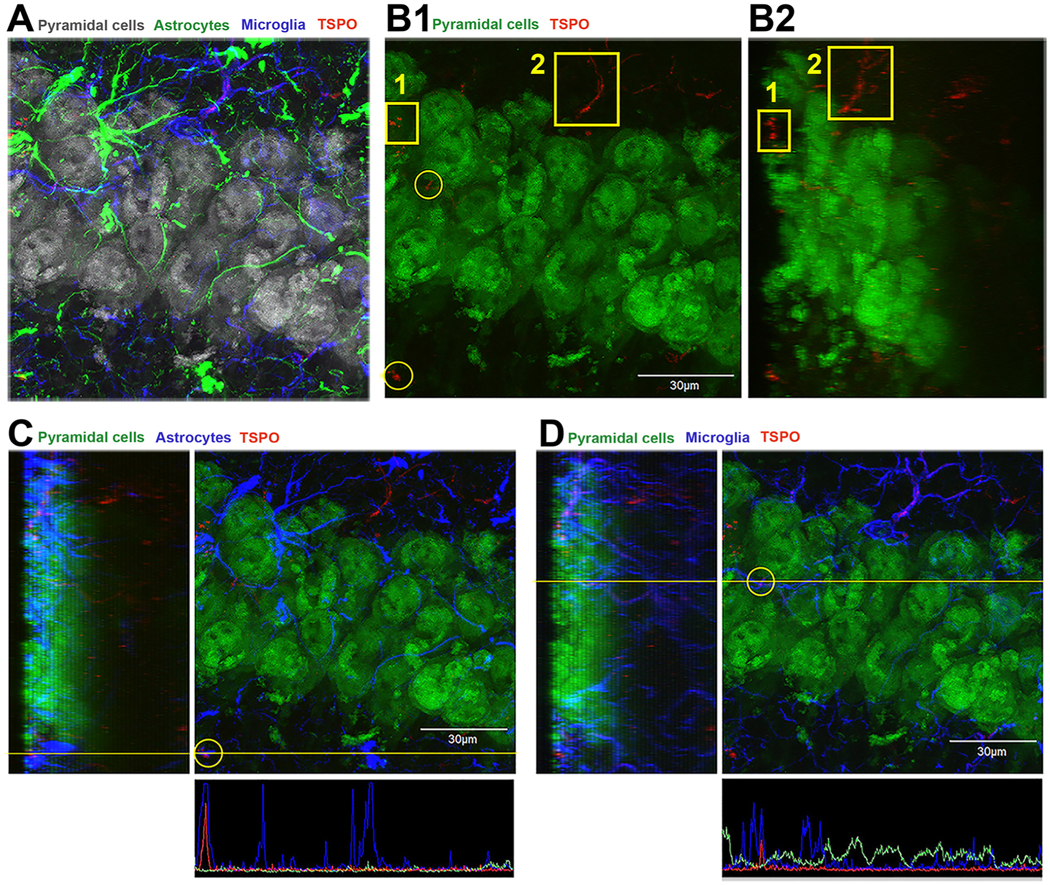
TSPO expression in the CA1 region of the hippocampus is not associated with neurons.
A) Quadruple immunofluorescence confocal imaging represented in a top-down view of a 3D condensed z-stack of pyramidal neurons (NeuN-gray color), astrocytes (GFAP-green color), microglia (Iba1-blue color) and TSPO (red color). The image shows the complex network of glial processes and cell bodies intimately touching pyramidal neurons and processes. B1) This image is the same as in panel A, but now pyramidal neurons labeled with NeuN are displayed in green and TSPO in red. The microglia and astrocyte signal were removed to visualize the spatial relationship between TSPO and neurons. Areas of TSPO are noted in the yellow boxes and circles. There is a low level of TSPO expression that is outside or interspersed between pyramidal neurons. B2) This image is the same as in panel B1, but it represents a 67.5 degree rotation of the z-stack showing that the TSPO staining is not localized with neurons. C) Same image as B1 but now the astrocyte (blue signal) is added and the colocalization of TSPO with astrocyte in the yellow circle is analyzed. The left side of the image is the side view of the zstack and the bottom is the intensity profile (yellow line) indicating signal colocalization of TSPO and astrocyte. D) A similar approach was used in panel D as in panel C, but in this case, the TSPO signal inside the yellow circle appears to colocalized with the microglia marker Iba1 (blue). Again, the side view of the z-stack shows that the TSPO signal colocalizes with microglia which is confirmed in the intensity profile (yellow line) of the signals in the bottom of panel D. (For interpretation of the references to colour in this figure legend, the reader is referred to the web version of this article.)
