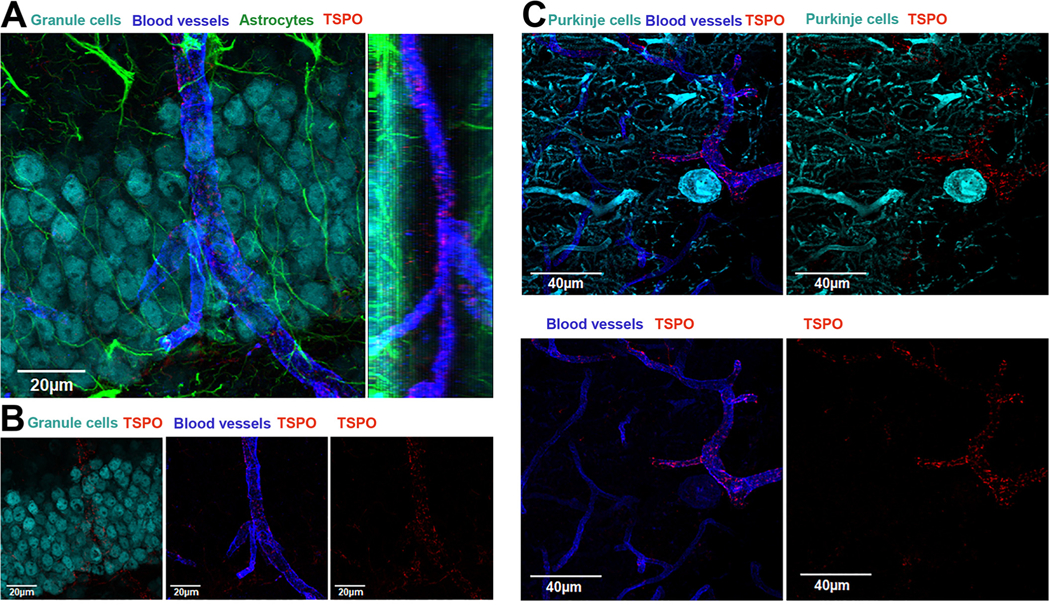
Fig. 5.

TSPO is highly expressed in blood vessels in the hippocampus and cerebellum of the normal mouse brain.
A) Quadruple immunofluorescence confocal imaging represented in a top-down view of a 3D condensed z-stack of neurons in the dentate gyrus in the hippocampus (NeuN-cyan), blood vessels (CD31-blue), astrocytes (GFAP-green), and TSPO (red). The image shows the presence TSPO in a blood vessel in close contact with neurons in the granule cell layer. To the right is the side view of the z-stack showing the blood vessel with several TSPO positive puncta. B) the different panels show the individual signals showing that TSPO is present in blood vessels. C) Triple immunofluorescence confocal imaging represented in a top-down view of a 3D condensed z-stack of Purkinje cells (calbindin – green), blood vessels (CD31 – blue), and TSPO (red). Left panel shows the 3 signals and the right panel shows Purkinje cell and TSPO. Lower left panel shows the presence of TSPO in the blood vessel and the lower right panel is TSPO only. (For interpretation of the references to colour in this figure legend, the reader is referred to the web version of this article.)
