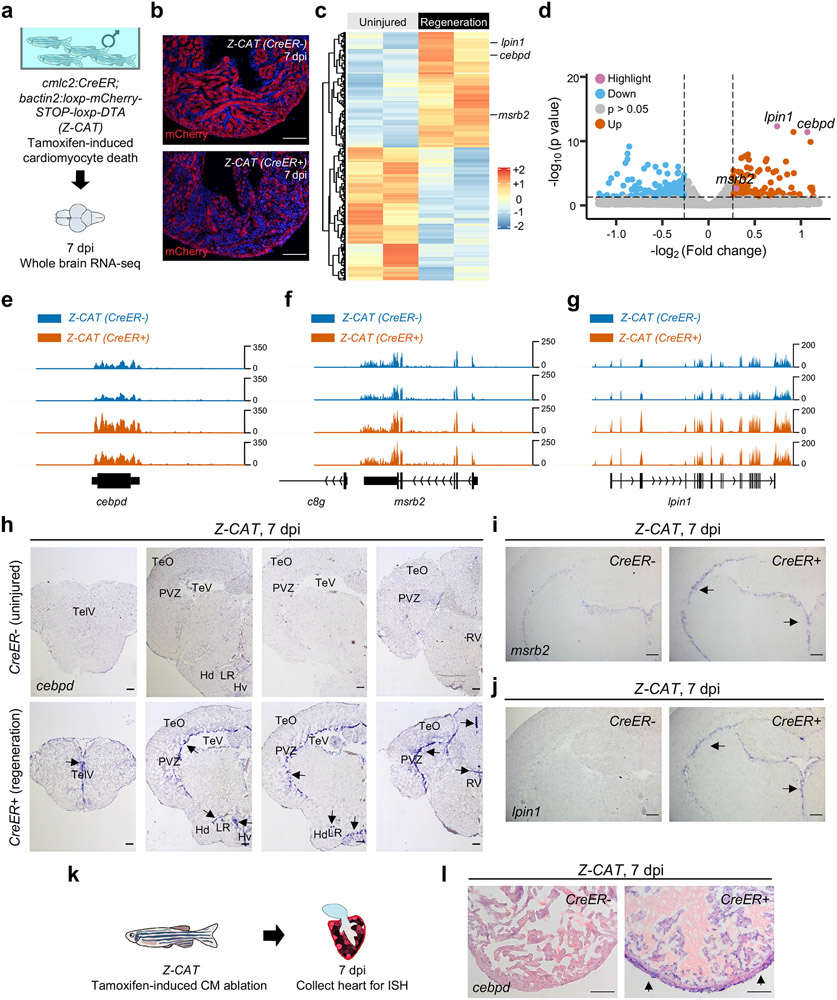
Fig. 1: cebpd is induced in local and remote tissues during heart regeneration.
a, Schematic of profiling whole brain transcriptomes after cardiomyocyte (CM) ablation. b, Heart sections from uninjured control fish (top; CreER−) and those with both injury transgenes (bottom; CreER+) at 7 days post tamoxifen incubation (dpi). c, Heat map of genes with changes in the brain during heart regeneration. p < 0.05, Fold change (FC) > 1.2. d, Volcano plot showing differential gene expression in the brain during heart regeneration. Pink dots: highlighted genes. Blue dots: genes with decreased RNA levels (p < 0.05, FC < −1.2). Grey dots: genes with no significant changes. Orange dots: genes with increased RNA levels (p < 0.05, FC > 1.2). e, RNA-seq browser track of cebpd showing increased brain cebpd transcript levels during heart regeneration. Brains from 10 individuals were pooled as one sample for RNA-seq. TPM = 8.65 and 6.94 for CreER− and 18.54 and 14.49 for CreER+. f,g, RNA-seq browser tracks of msrb2 and lpin1, showing increased brain transcript levels during heart regeneration. Data represent the average of two biological replicates in each experimental group. Tissues from 10 animals were pooled as one biological replicate. h, ISH of cebpd on cross sections of the brain indicating induction in the ependymal cell layer during heart regeneration. TelV: telencephalic ventricle. TeO: tectum opticum. TeV: tectal ventricle. PVZ: periventricular gray zone. LR: lateral recess of diencephalic ventricle. Hd: dorsal zone of periventricular hypothalamus. Hv: ventral zone of the periventricular hypothalamus. RV: rhombencephalic ventricle. n= 57 CreER− and 48 CreER+ animals. Optic tectum is subsequently used as an indication of cebpd induction in brain. Arrows indicate violet ISH signals. i,j, ISH of msrb2 and lpin1 on cross sections of the brain indicating induction in ependymal tissue during heart regeneration. n = 13 animals for each group. k, Schematic of inducing CM ablation and assessment of cardiac cebpd expression. l, ISH on heart sections indicating the induction of cebpd in epicardium and associated peripheral cells during heart regeneration. n = 20 CreER− and 43 CreER+ animals. Scale bars for a, b, h-j, l: 100 μm.

