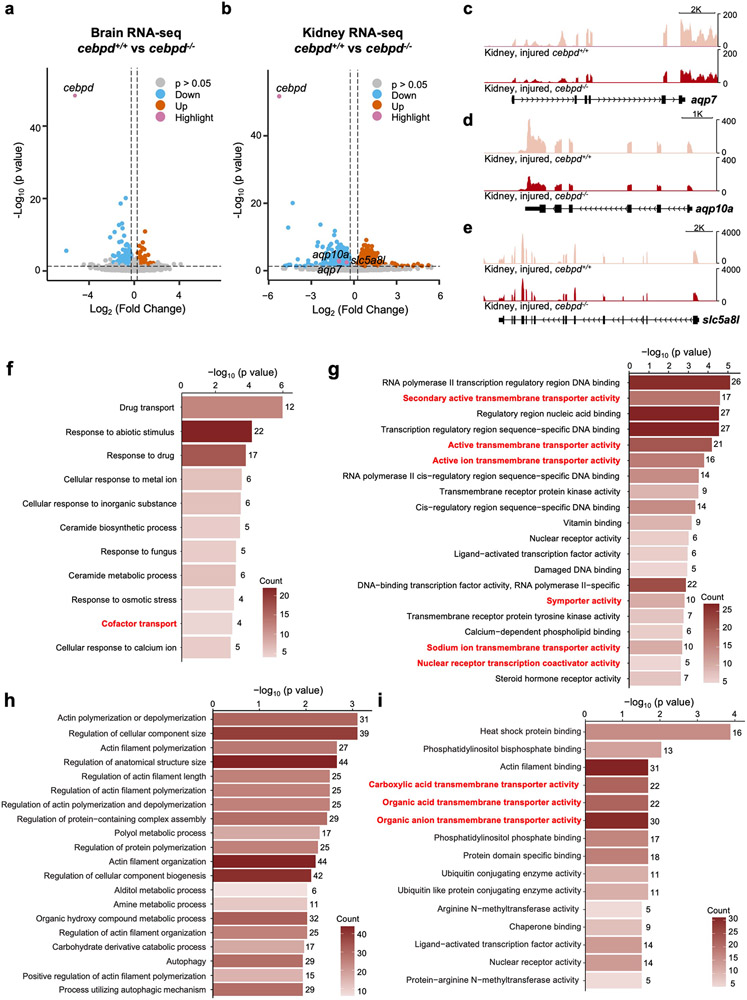
Extended Data Fig. 4. Transcriptome profiling of cebpd mutant brain and kidney during heart regeneration.
a,b, Volcano plot showing differential gene expression in the cebpd−/− brain (a) and kidney (b) during heart regeneration. 521 genes (158 genes increased and 363 genes decreased) and 1662 genes (787 increased and 875 decreased) were differentially regulated in the brain and kidney of cebpd−/− animals, respectively. Full lists of differentially expressed genes are shown in Supplementary Tables 2 and 3. Pink dots: highlighted genes. Blue dots: genes with decreased RNA levels (p < 0.05, FC < −1.2). Grey dots: genes with no significant changes. Orange dots: genes with increased RNA levels (p < 0.05, FC > 1.2). c, RNA-seq browser track of aqp7 showing decreased transcript levels of aqp7 (Log2FC = −1.062, p = 0.0012) in cebpd−/− kidney during heart regeneration. d, RNA-seq browser track of aqp10a showing decreased transcript levels of aqp10a (Log2FC = −1.045, p = 0.0020) in cebpd−/− kidney during heart regeneration. e, RNA-seq browser track of slc5a8l showing decreased transcript levels of slc5a8l (Log2FC = −0.515, p = 0.0034) in cebpd−/− kidney during heart regeneration. f,g, Gene Ontology analysis of differentially expressed genes in cebpd−/− brain during heart regeneration demonstrating top biological pathways (f) and molecular functions (g) with gene enrichment. Counts indicate the number of genes with significantly changed expression in Gene Ontology term. h,i, Gene Ontology analysis of differentially expressed genes in cebpd−/− kidney during heart regeneration demonstrating top biological pathways (h) and molecular functions (i) with gene enrichment. Counts indicate the number of genes with significantly changed expression in Gene Ontology term.

