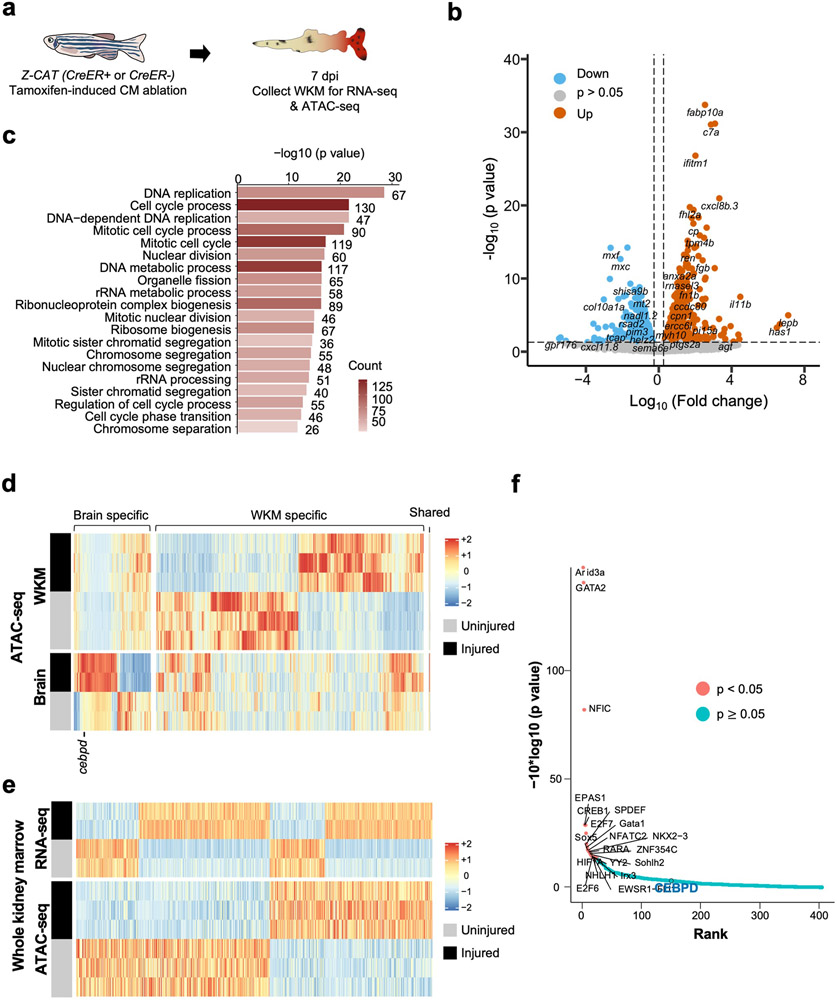
Extended Data Fig. 6. Transcriptome and epigenetic analysis of whole kidney marrow.
a, Schematic of CM ablation and whole kidney marrow (WKM) collection for RNA-seq and ATAC-seq. b, Volcano plot showing differential gene expression in WKM after cardiac injury. Blue dots: genes with decreased RNA levels (p < 0.05, FC < −1.2). Grey dots: genes without significant changes. Orange dots: genes with increased RNA levels (p < 0.05, FC > 1.2). c, Gene ontology analysis of top biological pathways with gene enrichment. p < 0.05. Counts indicate the number of genes with significantly changed expression in each biological pathway. d, Heatmap of chromatin regions with changes in accessibility in the brain and kidney after CM ablation. p < 0.05. e, Heatmaps of RNA-seq and ATAC-seq data representing putative enhancer elements linked to genes with significant transcriptional changes in WKM after a cardiac injury. f, BiFET analysis indicating enriched transcription factor binding to open regions in WKM chromatin regions cardiac injury. Red: p < 0.05. Blue: p ≥ 0.05.

