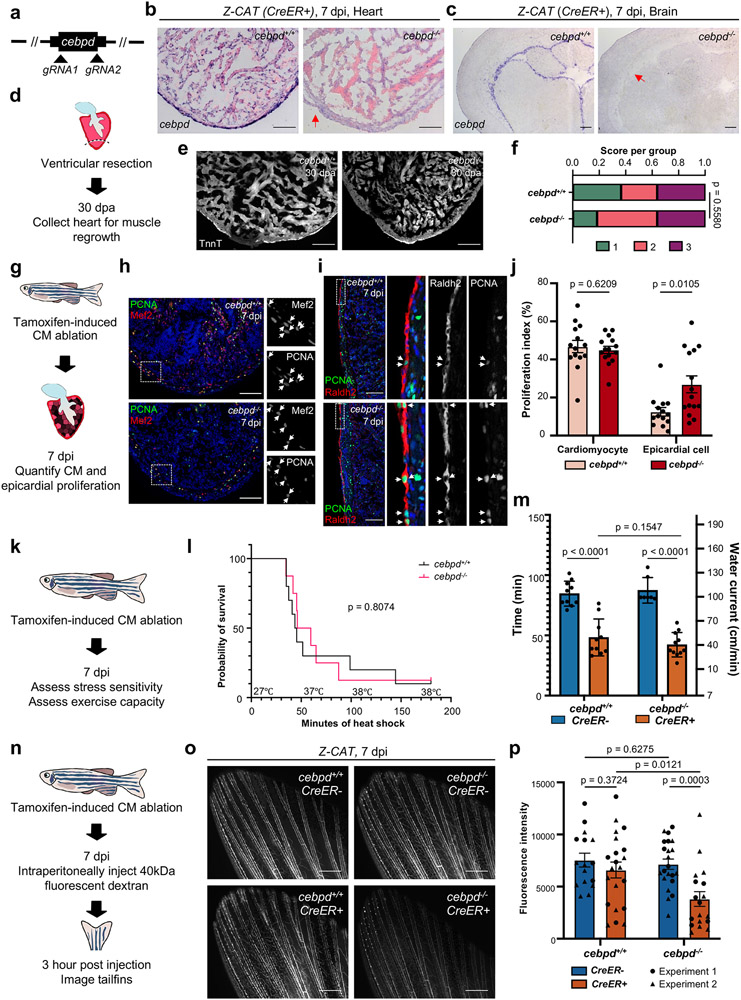
Fig. 3: Local and remote Cebpd requirements during heart regeneration.
a, Schematic of cebpd deletion. b,c, cebpd transcript is undetectable in cebpd−/− hearts and brains by ISH after genetic CM ablation. Red arrow indicates loss of ISH signals in cebpd−/− tissues. Loss of cebpd expression was confirmed for all experiments performed with cebpd−/− animals. d, Schematic of cardiac regeneration study. e, Sections of cardiac ventricles in wild-type and cebpd−/− animals, stained with Troponin-T antibody. n reported in (f). f, Semiquantitative assessment of cardiac injuries. 1: Robust regeneration. 2: Partial regeneration 3: Blocked regeneration. Single trial with n = 11 animals for each group. Fisher’s exact test. g, Schematic of cardiac cell proliferation study. h, Sections of 7-day post CM ablation ventricles stained for CM nuclei (Mef2; Red) and cell cycling (PCNA; Green). White arrows indicate proliferating CMs. n reported in (j). i, Sections of 7-day post CM ablation ventricles stained for epicardium (Raldh2; Red) and cell cycling (PCNA; Green). Arrows indicate cycling epicardial cells. Single channel images of single confocal slice in greyscale. n reported in (j). j, Quantification of data from (h, i). Single trial with n = 14 cebpd+/+ and 15 cebpd−/− animals. Mean ± S.E.M., Two-tailed Mann Whitney test. k, Schematic of inducing CM ablation and assessment of heart failure. l, Survival curves of heat-stressed zebrafish during heart regeneration. Single trial with n = 10 cebpd+/+ and n = 8 cebpd−/− animals. Log-rank (Mantel-Cox) test. m, Assays for swim capacity during heart regeneration. Single trial with n = 11 CreER− and 10 CreER+ cebpd+/+ animals, and n = 7 CreER− and 11 CreER+ in cebpd−/− animals. Mean ± S.D., unpaired two-tailed Student’s t-test. n, Schematic of experiments assessing fluorescent dye transfer into vasculature. o, Fluorescence images indicating inefficient dye transfer in injured cebpd−/− animals. p, Quantification of experiments in (o). Two independent trials with n = 16 CreER− and 21 CreER+ cebpd+/+ animals, and n = 22 CreER− and 18 CreER+ cebpd−/− animals. Mean ± S.E.M., unpaired two-tailed t-test. Scale bars in b, c, e, h, i: 100 μm. Scale bars in o: 500 μm.

