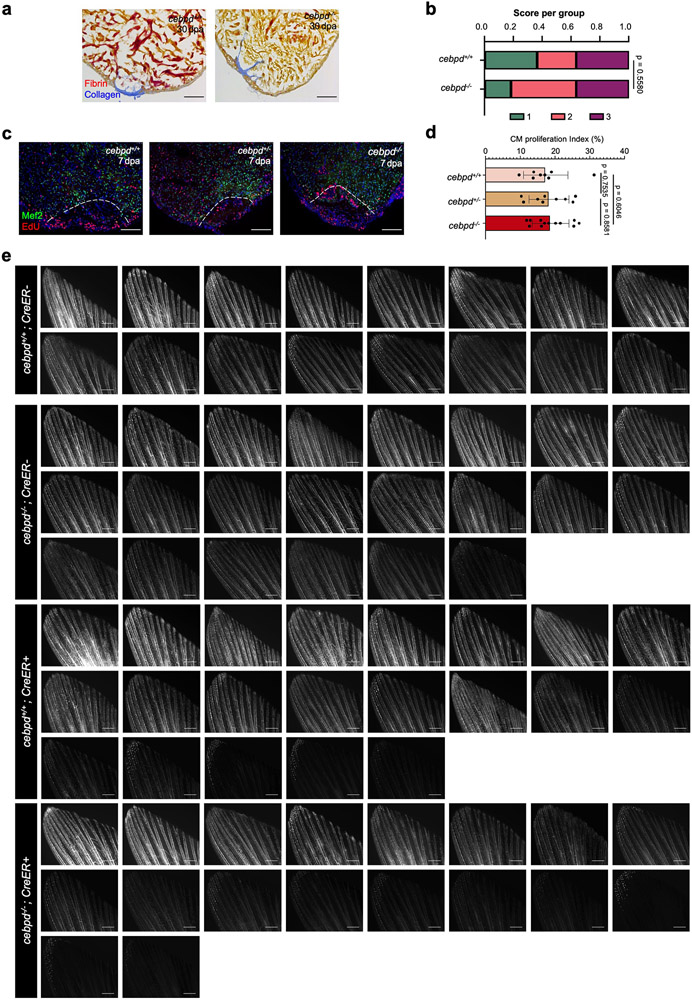
Extended Data Fig. 3. Cardiac muscle regeneration and fluid regulation in cebpd mutant animals.
a, Representative sections of cardiac ventricles 30 days after resection (dpa) in wild-type and cebpd−/− animals, stained with AFOG. Scale bar: 100 μm. n reported in (b). b, Semiquantitative assessment of cardiac injuries based on muscle and scar morphology, indicating no significant difference between cebpd−/− animals and their wild-type siblings. 1: Robust regeneration. 2: Partial regeneration 3: Blocked regeneration. A single trial was performed, with n = 11 animals for each group. Data were analyzed using a Fisher’s exact test. c, Sections of 7 days post resection (dpa) ventricles staining with markers for CM nuclei (Mef2; green) and cell cycle entry (EdU; red). Dashed lines outline the approximate resection injury site. Scale bars: 100 μm. d, Quantification of the CM cycling index at 7 dpa indicating no significant differences in cebpd knockout animals compared to their wild-type siblings. A single trial was performed with n = 8 cebpd+/+animals, 9 cebpd+/− animals, and 12 cebpd−/− animals. Mean ± s.d.. Data were analyzed using an unpaired two-tailed Student’s t-test. e, Fluorescence images of tailfin vasculature indicating that significantly less fluorescent dextran was able to reach the circulatory system of cebpd−/− fish after cardiac injuries. Data are quantified in Fig. 3. n = 16 CreER− and 21 CreER+ animals for cebpd+/+, and n = 22 CreER− and 18 CreER+ animals for cebpd−/−. Scale bars: 500 μm.

