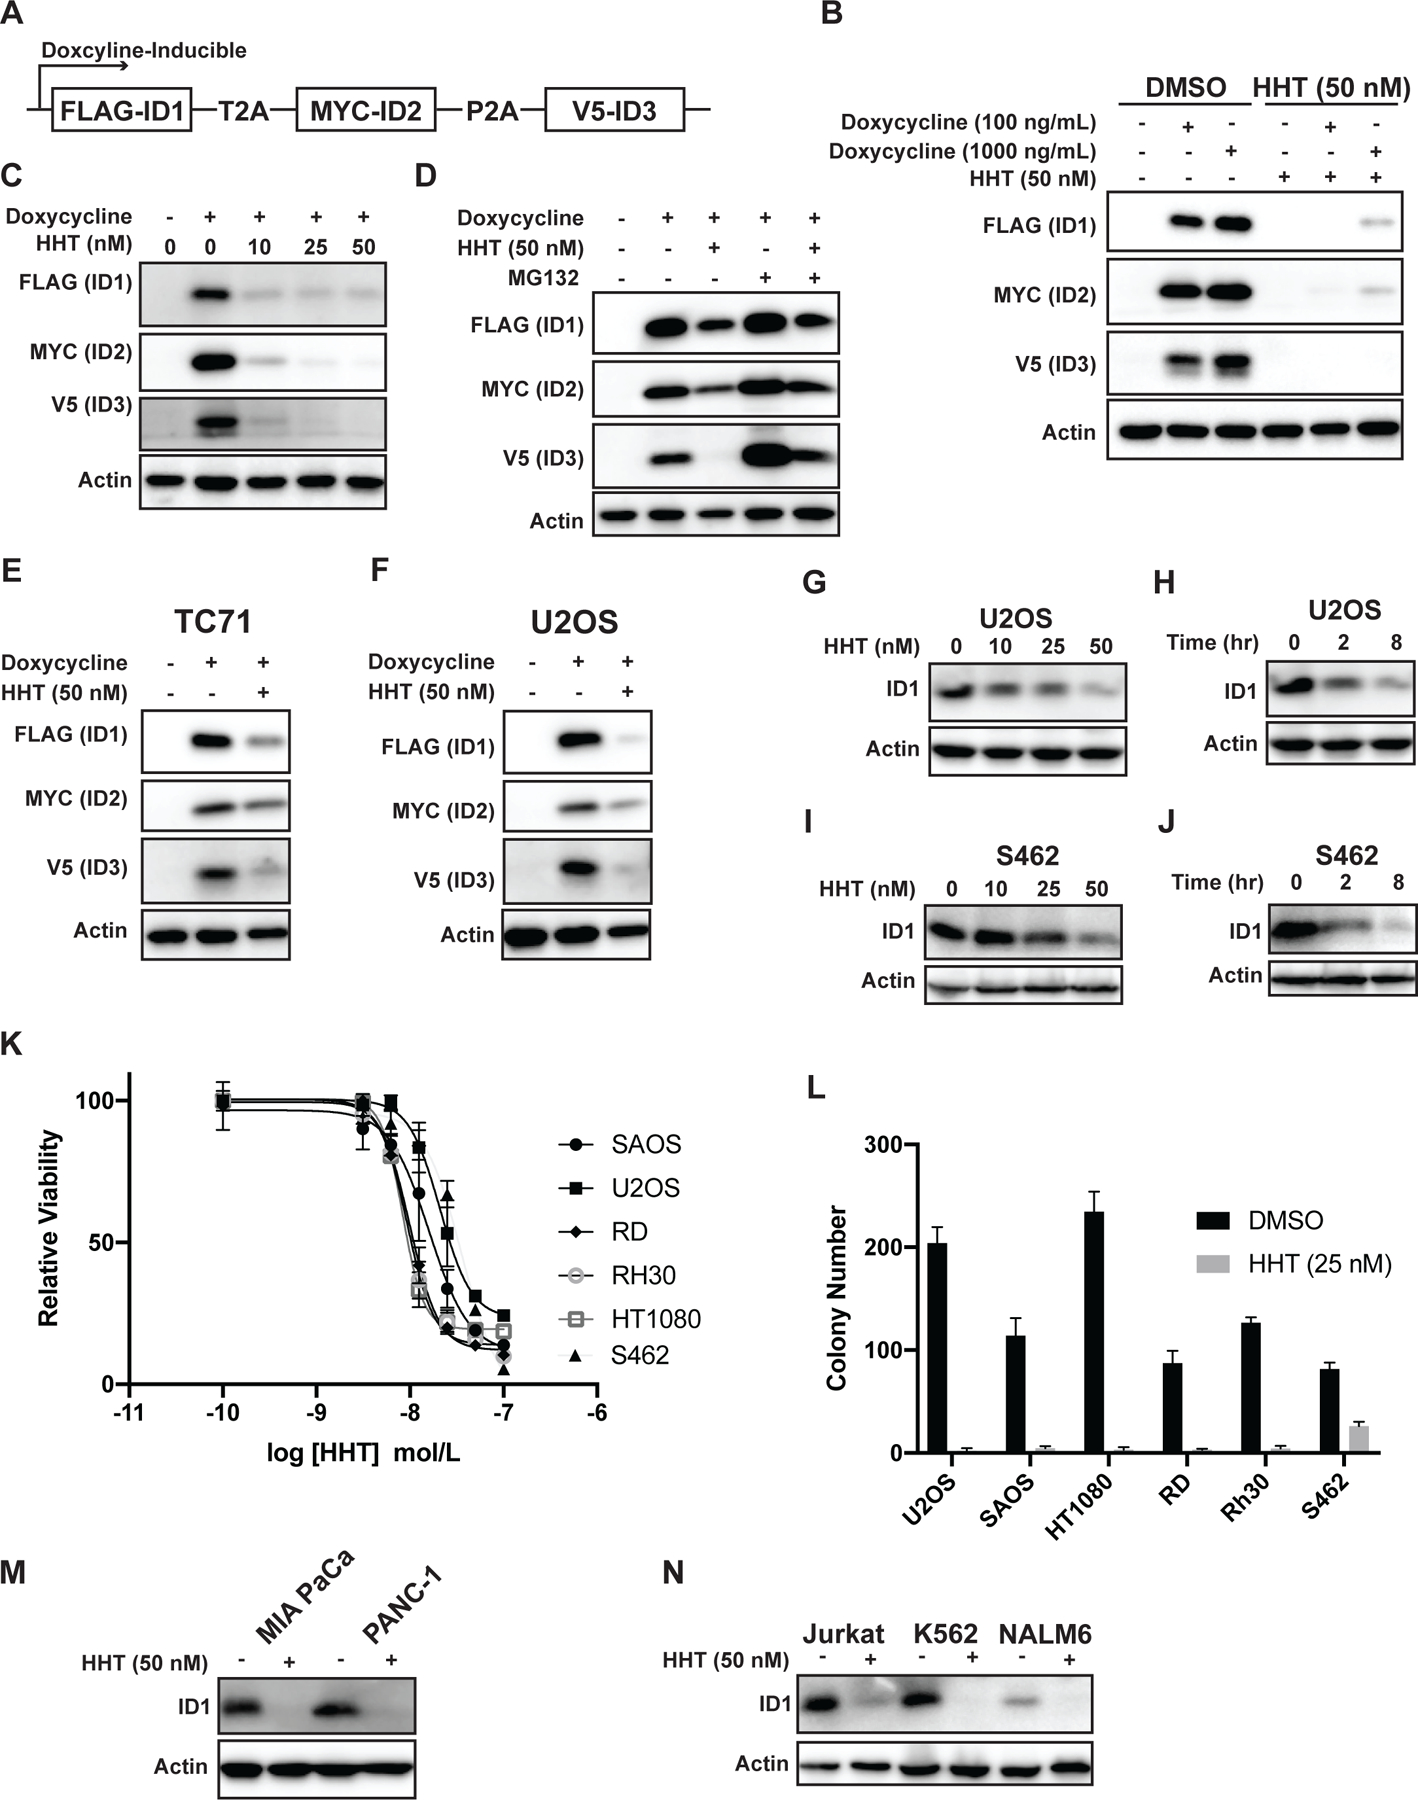
Figure 5. HHT reduces the levels of the ID1, ID2, and ID3 proteins in sarcoma cell lines.

(A) Schematic of a doxycycline-inducible, lentiviral expression vector that expresses Flag-ID1, Myc-ID2, and V5-ID3 from a single mRNA transcript using P2A/T2A elements. (B) Immunoblot of 293T cells with doxycycline-inducible expression of Flag-ID1, Myc-ID2, and V5-ID3 (293T-ID1–3) treated with HHT 50 nM for 24 hours. (C) 293T-ID1–3 cells were treated with different doses of HHT for 24 hours and then lysates were immunoblotted for the epitope tags. (D) 293T-ID1–3 cells were treated with HHT 50 nM in the presence or absence of the proteasome inhibitor MG132. Lysates were then collected and immunoblotted for the epitope tags for ID1–3. (E-F) Immunoblot of Ewing sarcoma (E) and osteosarcoma (F) cell lines expressing Flag-ID1, Myc-ID2, and V5-ID3 treated with HHT (50 nM) for 24 hours. (G) The osteosarcoma cell line U2OS was treated with HHT for 24 hours and lysates were then immunoblotted for ID1. (H) U2OS osteosarcoma cells were treated with HHT 50 nM for different amounts of time and lysates were then immunoblotted for ID1. (I) The MPNST cell line S462 was treated with HHT for 24 hours and lysates were then immunoblotted for ID1. (J) S462 cells were treated with HHT 50 nM for different amounts of time and lysates were then immunoblotted for ID1. (K) Dose-response curves for osteosarcoma (U2OS, SAOS), rhabdomyosarcoma (RD, RH30), fibrosarcoma (HT1080), and MPNST (S462) cell lines treated with different concentrations of HHT for 72 hours. Cell viability was assessed using the AlamarBlue Fluorescence Assay. The results are representative of two independent experiments. Error bars represent mean ± SD of three technical replicates. (L) Colony formation assay for sarcoma cell lines treated with HHT 25 nM or vehicle. Error bars represent the mean ± SD of three technical replicates. (M-N) Pancreatic cancer (M) and leukemia (N) cell lines were treated with HHT (50 nM) for 24 hours and then immunoblotted for ID1.
