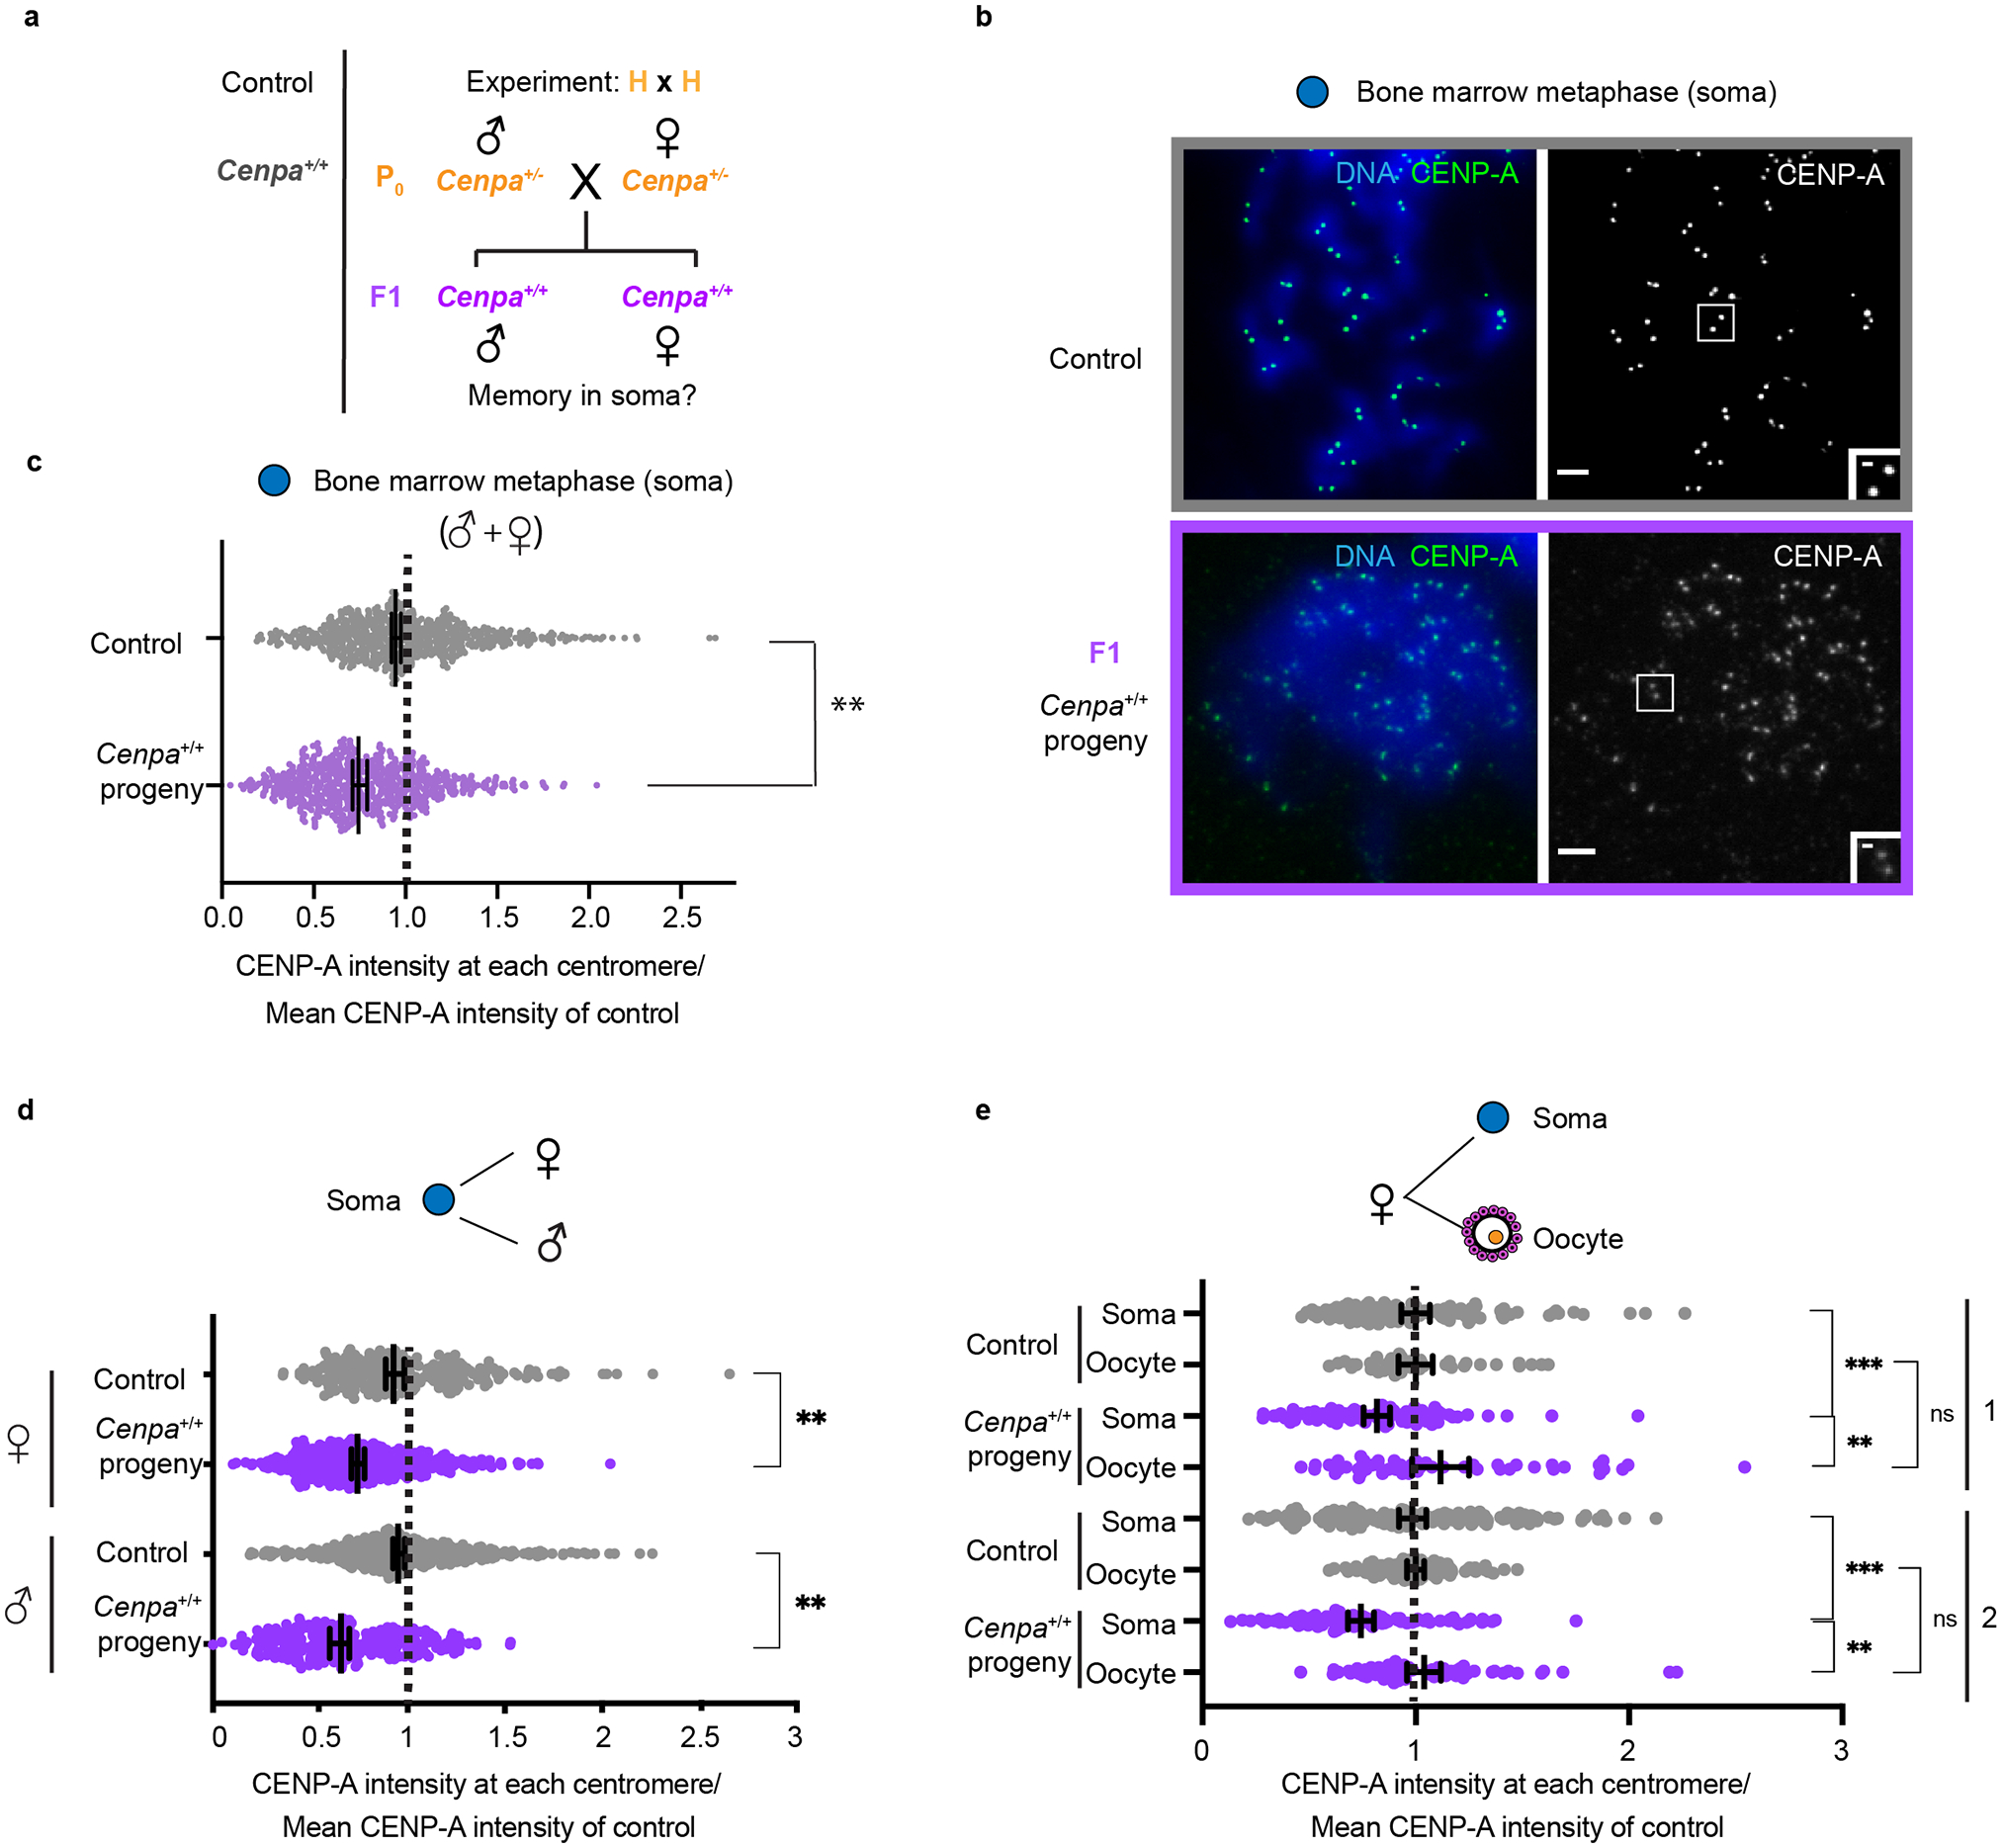
Fig. 2: Male and female soma show reduced CENP-A in contrast to oocytes.

a, Mating scheme to test memory in the soma in the F1 generation. b, Bone marrow metaphase spreads (control and F1 generation) are representative of both male and females: each pair of CENP-A foci represents sister centromeres in mitosis. c, Quantification of CENP-A foci intensities in control (grey) and F1 (purple) generations in male and female soma combined. N = 642, 684 centromeres (top to bottom). **/* P<0.0001/P< 0.05, Mann-Whitney U test (two-tailed). d, Pooled male and female CENP-A intensities from Fig. 2c, replotted with male and female separated to show that both contain weakened centromeres. N = 251, 433, 390, 251 centromeres (top to bottom). e, Quantification of CENP-A chromatin showing weakened centromeres in the soma compared to oocytes from the same female. Two independent experiments (1, 2) are shown, each comparing a single F1 animal (from H × H cross) to controls. N = 112, 44, 94, 51, 169, 89, 98, 68 centromeres (top to bottom). **/*= P<0.001/P<0.01, Mann-Whitney U test (two tailed). Error bars: median ± 95% CI. Scale bars: 5 μm (main panel), 1μm (inset). Source numerical data are available in source data.
