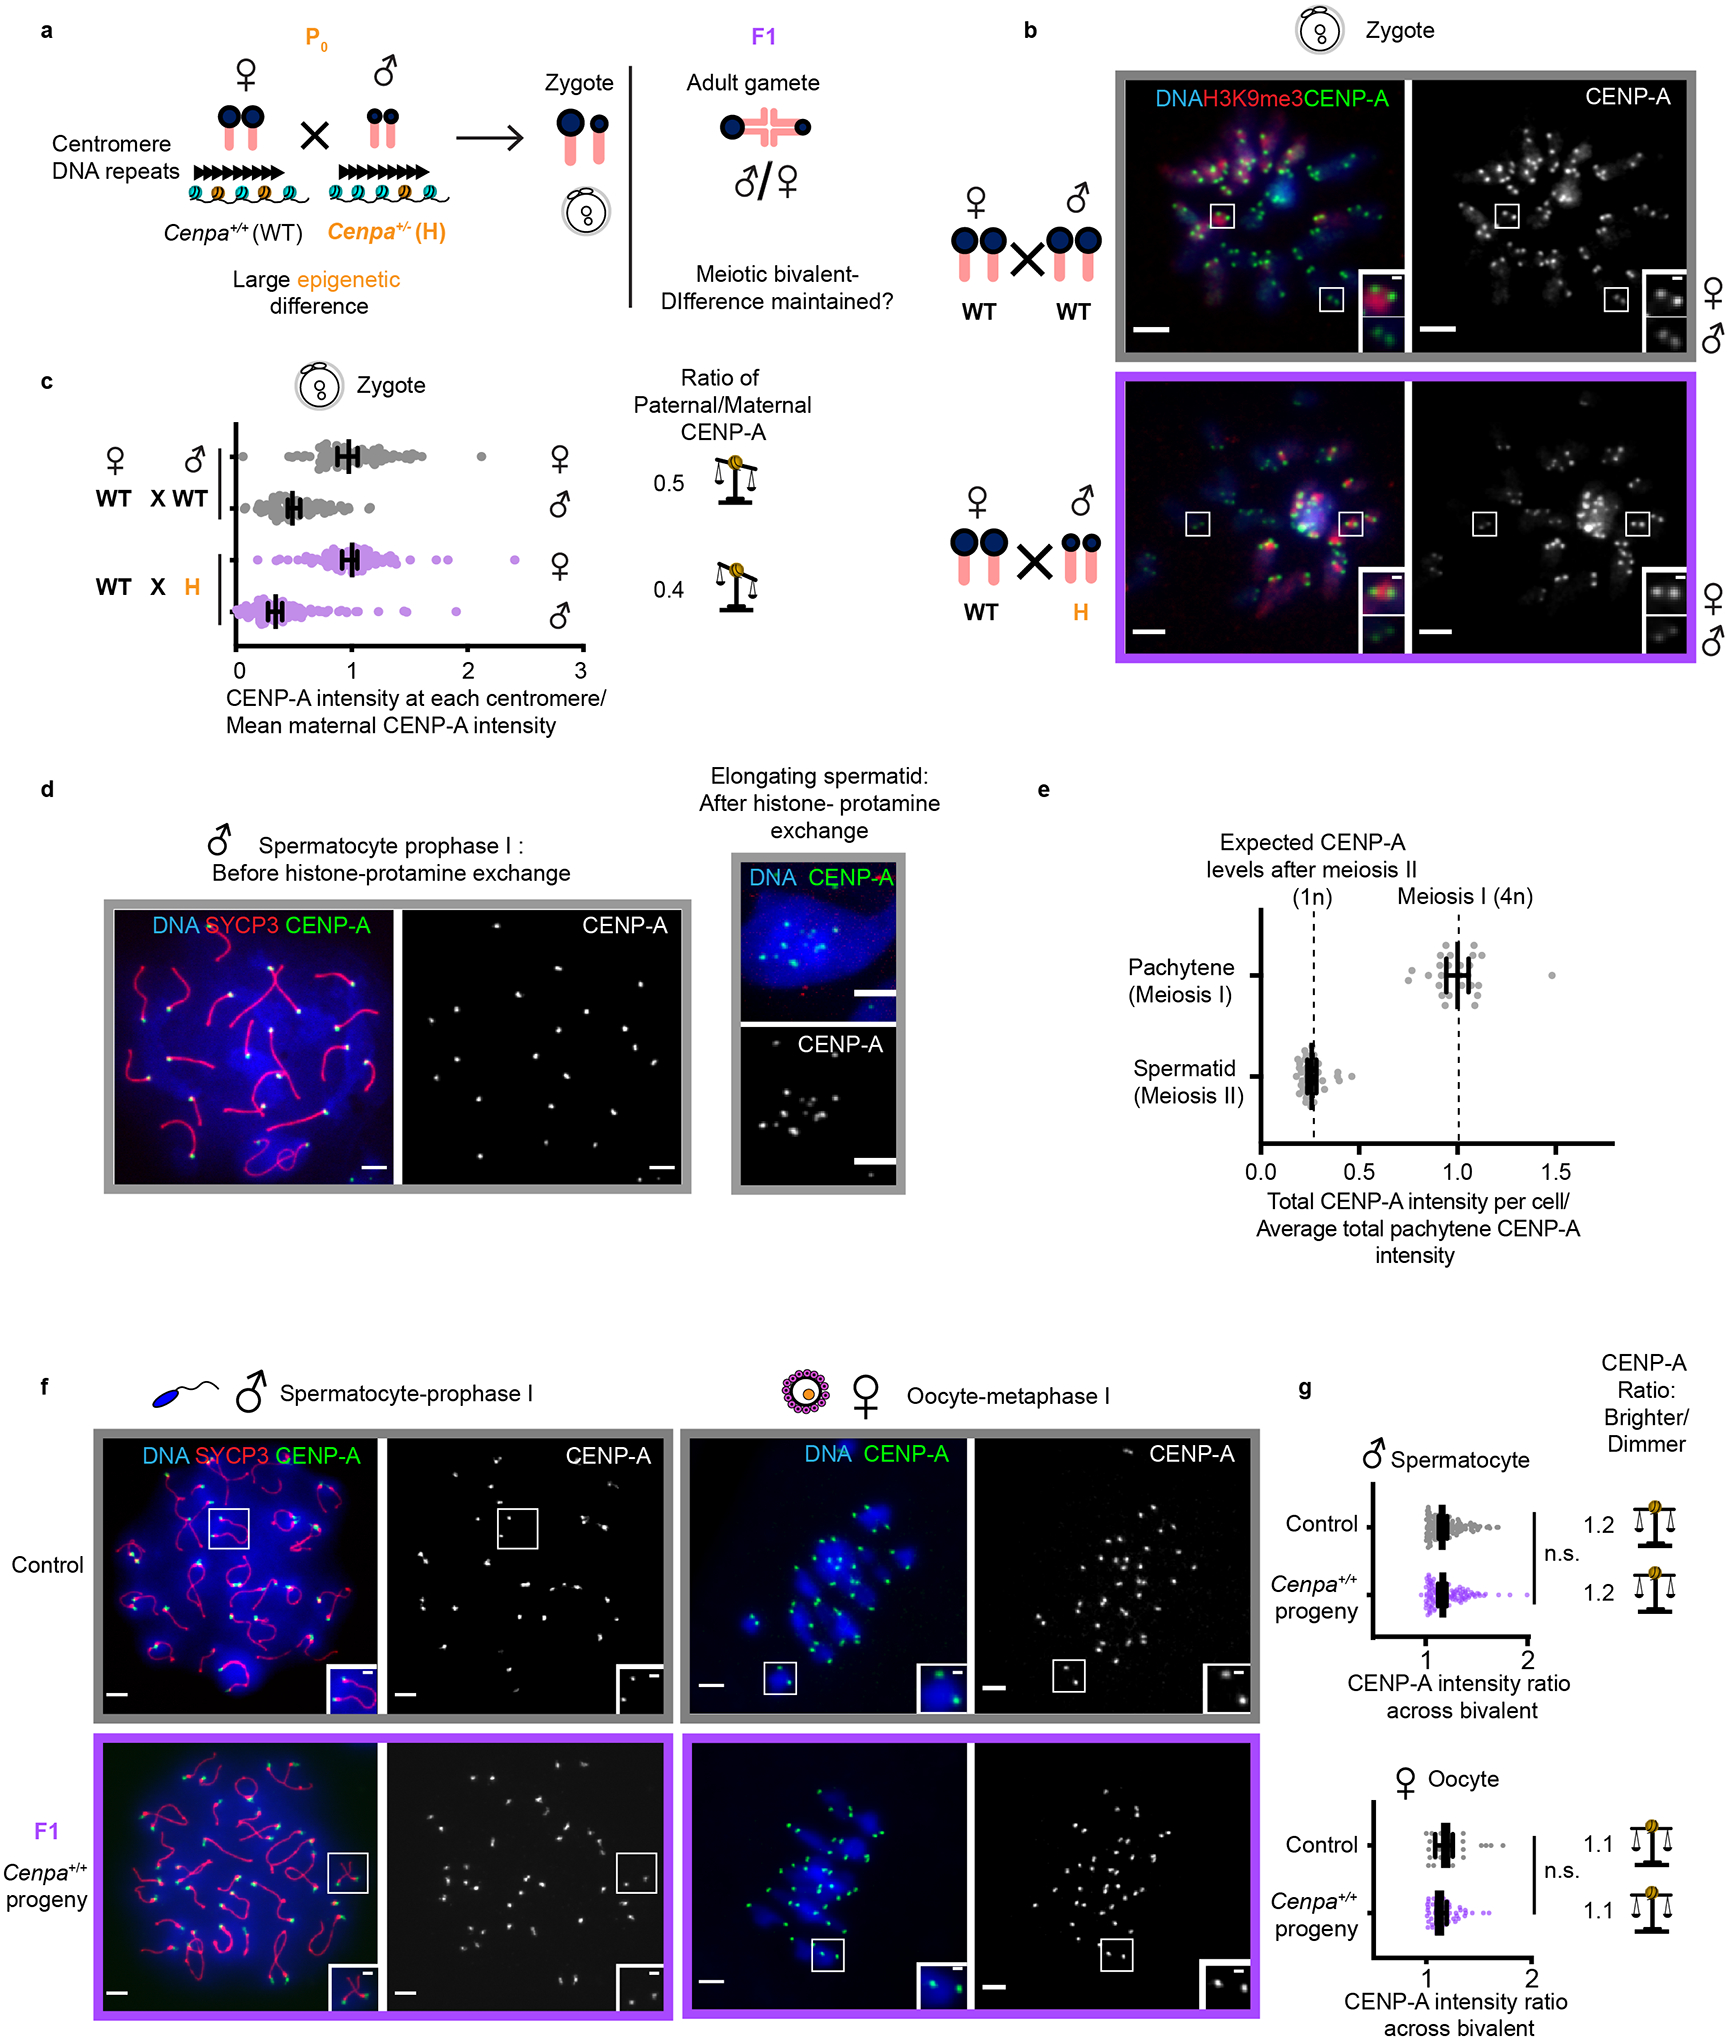
Fig. 3: Epigenetic differences between parental centromeres are not maintained.

a, Mating scheme to create epigenetic differences between maternal and paternal centromeres in F1. b, Zygotes (one-cell embryos) from WT × WT (control) and WT♀ × H♂ crosses. Each pair of CENP-A foci represents sister centromeres in mitosis. Insets show 1.5x magnified maternal and paternal centromeres distinguished by H3K9me3. c, Quantification of maternal and paternal CENP-A intensities are shown in zygotes combined from two independent experiments with ratios designated for each cross; N = 89, 90, 145, 143 centromeres (top to bottom). The balance symbol indicates the extent of epigenetic differences between parental centromeres. d, Representative images of spermatocyte pachytene (prophase of meiosis I, 4n) and an elongating spermatid (after completing meiosis II and histone-protamine exchange50,51, 1n) from control (Cenpa+/+) animals. e, Quantification of total CENP-A levels per cell; N = 26 spermatocytes or 35 spermatids. The observed reduction to 25% in spermatids (1n) compared to prophase I spermatocytes (4n) is expected if there is no loss during the histone-protamine exchange. f, Diplotene spermatocyte spreads and metaphase I oocytes in F1. During diplotene, centromeres of paired homologous chromosomes (marked with SYCP3 in red) can be resolved. Each inset shows a pair of homologous chromosomes (bivalent), and each of the CENP-A foci represents two sister centromeres. g, Quantification of the ratio of CENP-A foci intensities across a meiotic bivalent (brighter/dimmer) in male and female gametes from d, N = 122, 124, 30, 56 bivalents (top to bottom). n.s.: P>0.05, Mann Whitney U test (two tailed). Error bars: median ± 95% CI. Scale bars: 5 μm (main panel), 1μm (inset). Source numerical data are available in source data.
