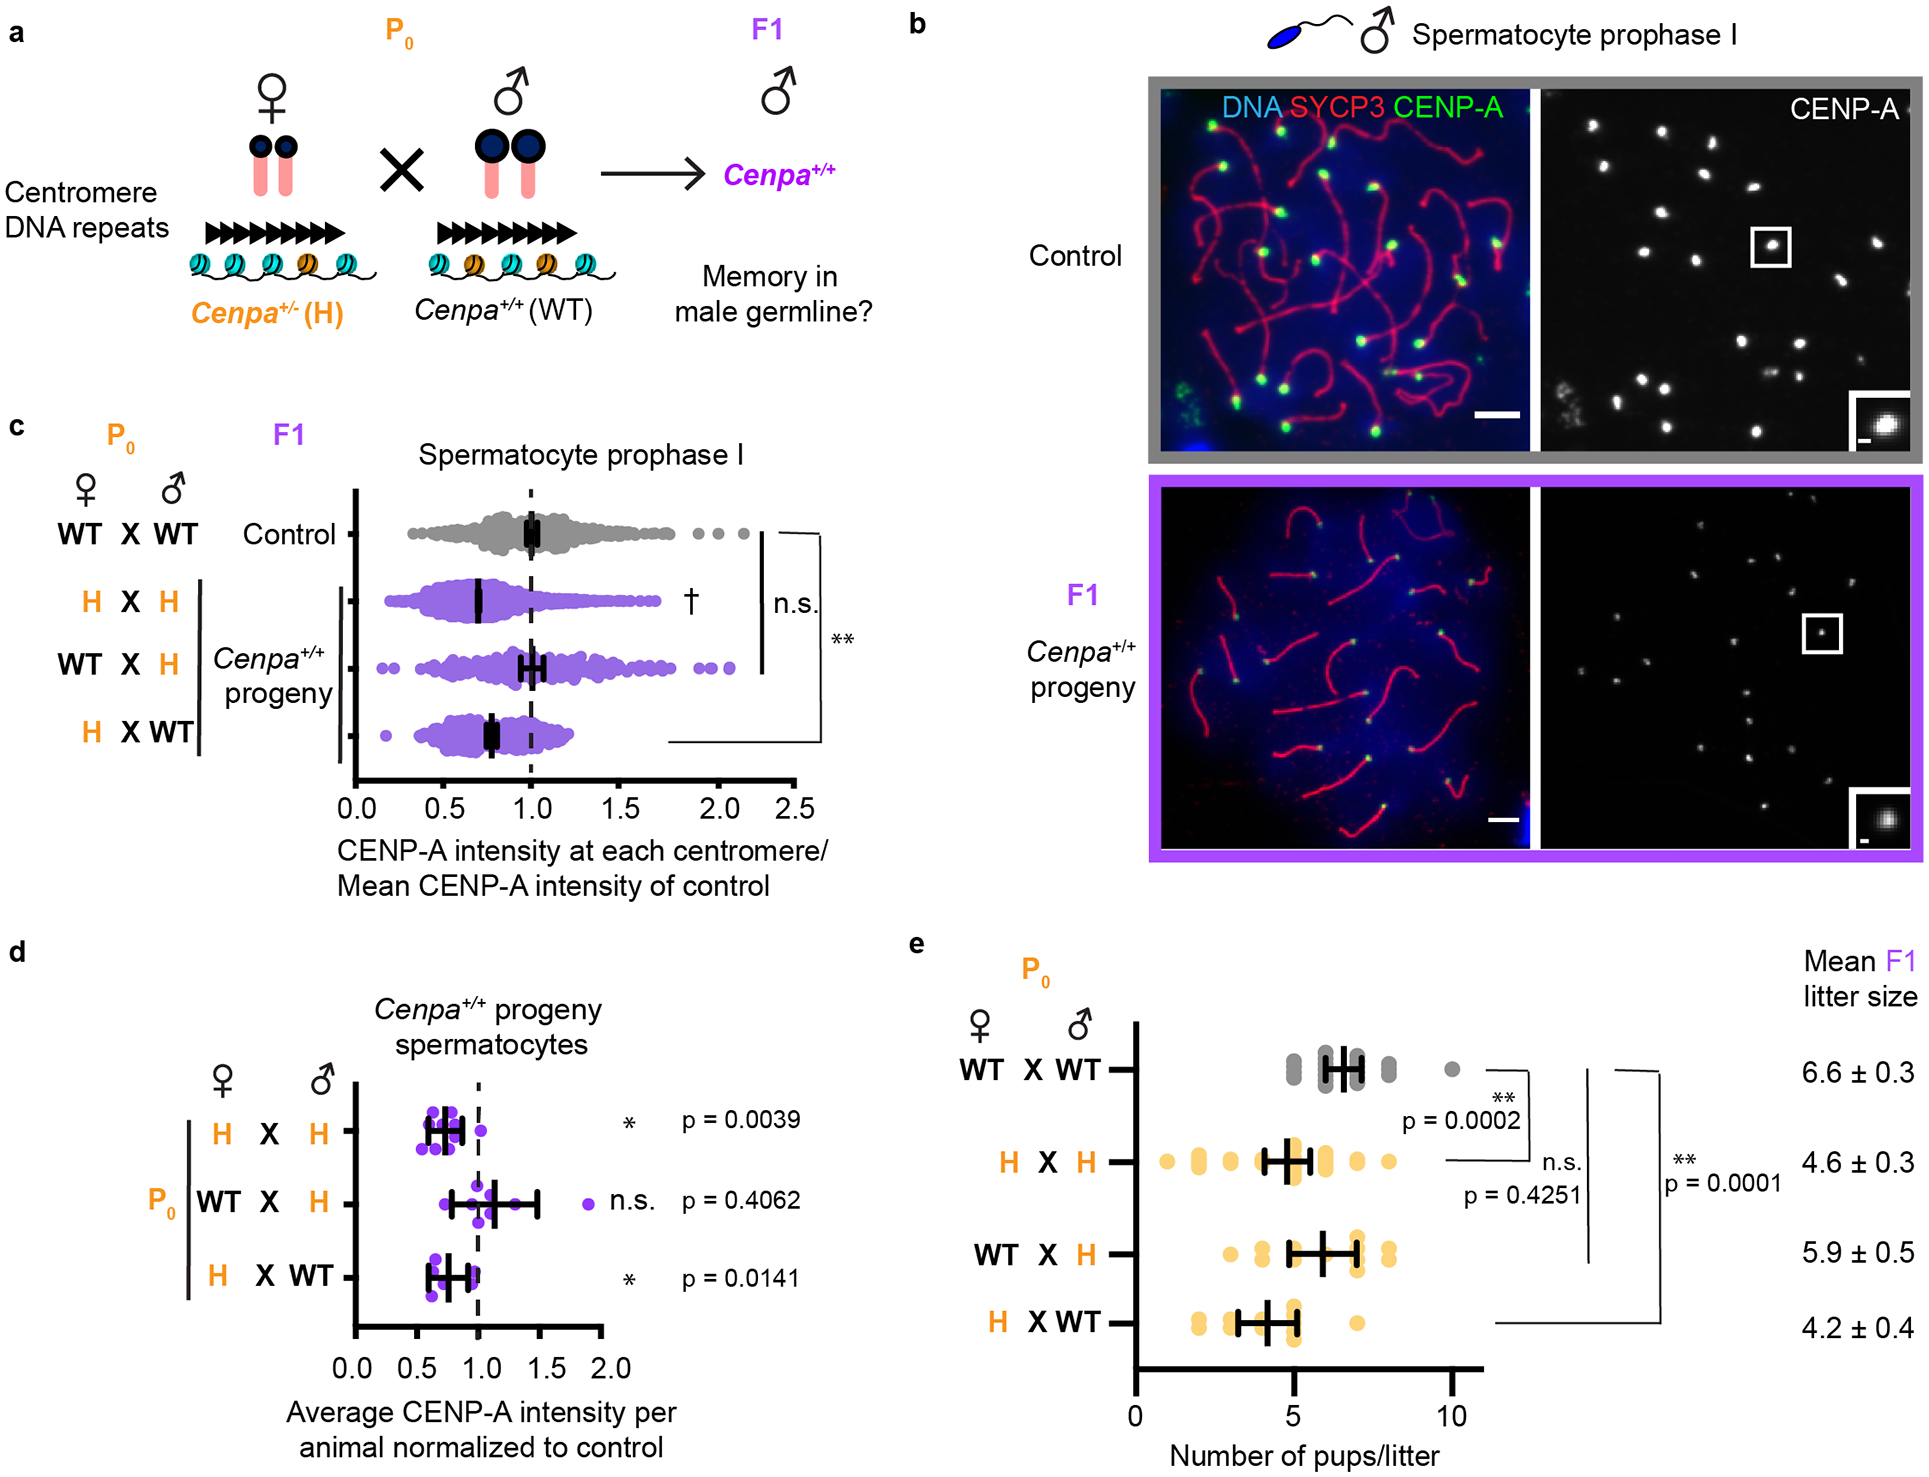
Fig. 4: Centromere strength depends on maternally inherited CENP-A.

a, Mating scheme to test Cenpa maternal contribution. b, Prophase I spermatocytes from control and F1 progeny of H♀ × WT♂ cross. Each of the CENP-A foci represents four centromeres from a pair of homologous chromosomes. Scale bars: 5 μm (main panel), 1μm (inset). c, Quantifications of CENP-A foci intensities in F1 spermatocytes from the indicated crosses. Representative images shown in Fig. 1d (H × H, data replotted for comparison from Fig. 1c), Fig. 3f (WT♀ × H♂), and Fig. 4b (H♀ × WT♂). N = 536, 1836†, 267, 604 centromeres (top to bottom). d, Data from Fig. 4c replotted by averaging over all centromeres from spermatocytes in each animal, normalized to controls (dashed line). N = 10, 8, 6 animals (top to bottom). e, Litter sizes from the indicated crosses. N = 21, 26, 12, 12 litters (top to bottom). Mean ± S.E.M. for each cross is shown next to the graph. *P<0.05, n.s.: P>0.05, Wilcoxon signed sum rank test (two tailed). ** P<0.0001, n.s. P>0.05, Mann-Whitney U test (two tailed). Error bars: median ± 95% CI. Source numerical data are available in source data.
