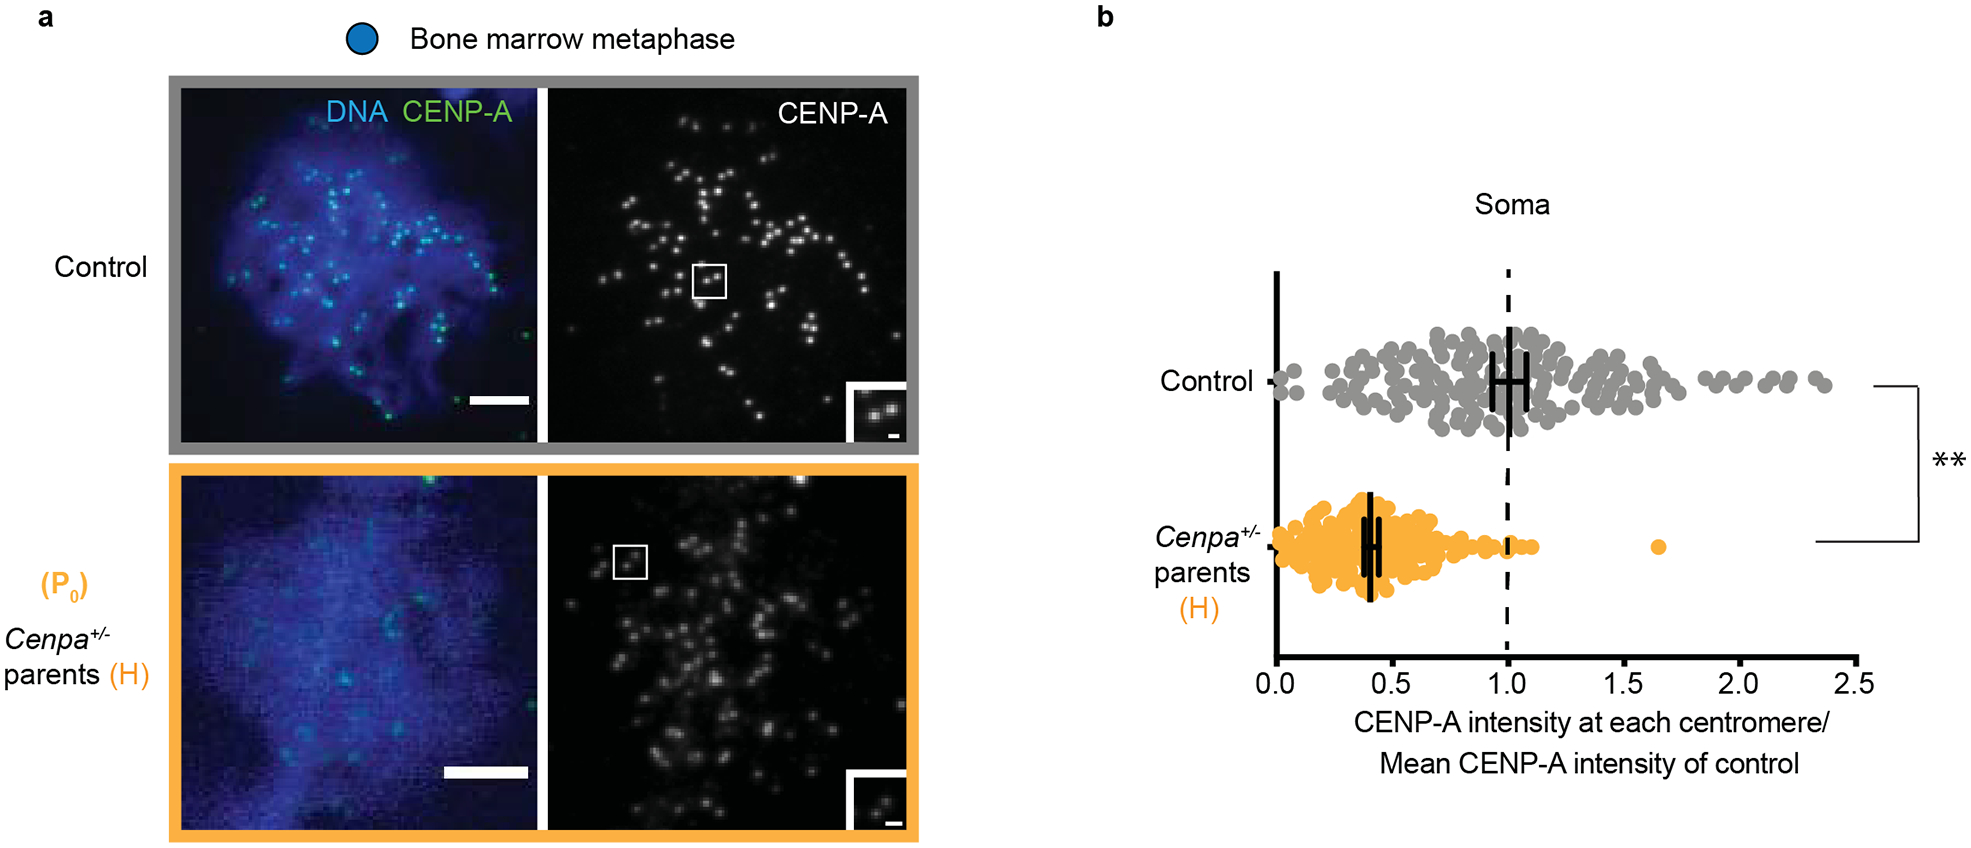
Extended Data Fig. 1. CENP-A chromatin is reduced in the soma of Cenpa+/− heterozygous animals in the P0 generation.

a, Bone marrow metaphase spreads: each pair of CENP-A foci represents sister centromeres in mitosis. Scale bars: 5 μm (main panel), 1μm (inset). b, Quantification of CENP-A foci intensities in control (grey) and P0 (yellow) generation in soma. N = 166, 170 centromeres (top to bottom). ** P<0.0001, Mann-Whitney U test (two tailed). Error bars: median ± 95% CI. Source numerical data are available in source data.
