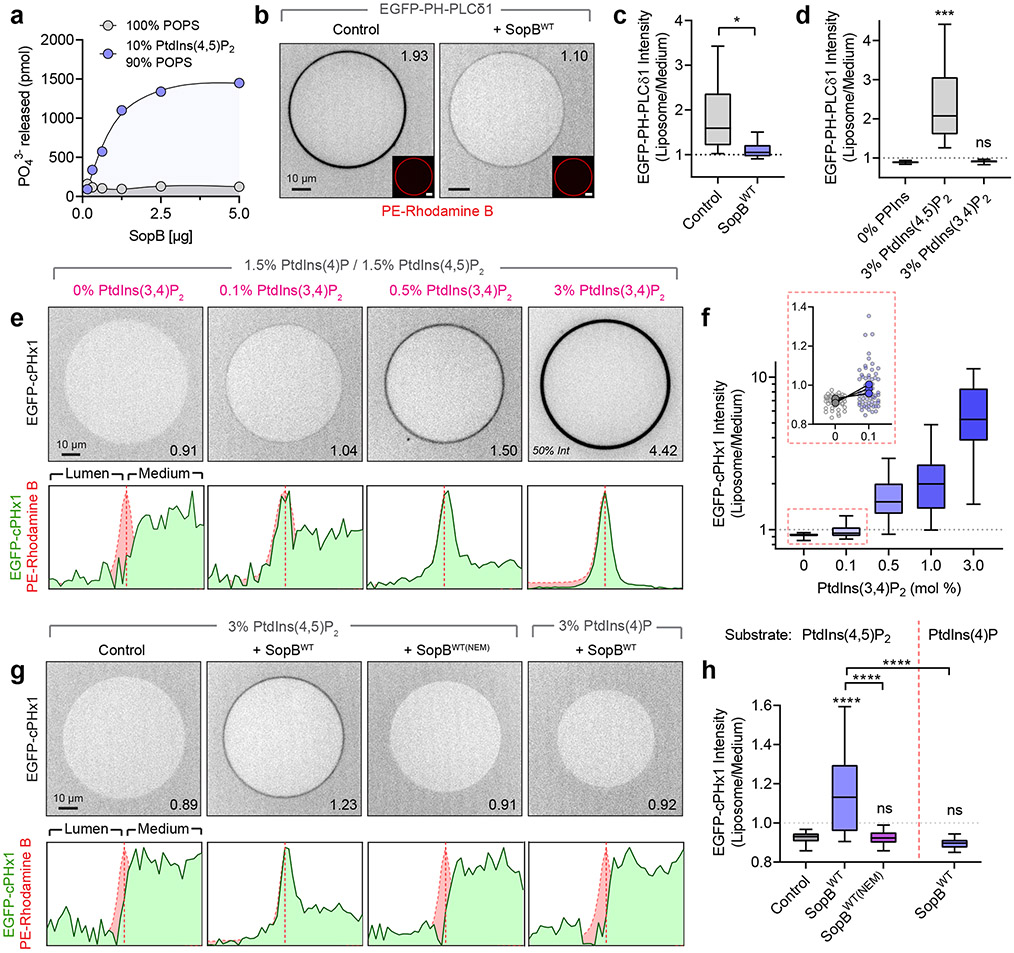
Fig. 7∣. In vitro reconstitution reveals SopB phosphotransferase activity.
(a) Inorganic phosphate release following 30 min treatment of liposomes of the indicated composition with recombinant SopBWT. Data are mean ± SEM of duplicate wells from a representative experiment.
(b) Confocal micrographs of GUVs treated for 30 min with SopBWT or an equal volume of dialysis buffer (control). Liposome composition was PtdCho:PtdSer:PtdIns(4,5)P2:PtdEth-Rhodamine B:DSPE-PEG-Biotin (76.8:20:3:0.1:0.1 mol %). Recombinant EGFP-PH-PLCδ1 (1 μM) was added before microscopy. Throughout the Figure, inset numbers are the Liposome/Medium EGFP intensity for the representative liposome.
(c) Normalized EGFP-PH-PLCδ1 liposome intensity from (b) across n=4 independent experiments (control, 142 GUVs; SopBWT, 155 GUVs). Data are median, box (25th-75th) and whisker (5th-95th) percentiles of individual liposome measurements. *P = 0.0269.
(d) Normalized EGFP-PH-PLCδ1 liposome intensity from n=3 independent experiments (0% PPIns, 86 GUVs; 3% PtdIns(4,5)P2, 84 GUVs; 3% PtdIns(3,4)P2, 83 GUVs). Data are median, box (25th-75th) and whisker (5th-95th) percentiles of individual liposome measurements. ***P = 0.0006.
(e) Representative micrographs of recombinant EGFP-cPHx1 (0.5 μM) incubated with increasing mol % PtdIns(3,4)P2. Background composition of liposomes was PtdCho:PtdIns(4,5)P2:PtdIns(4)P:PtdIns(3,4)P2:PE-Rhodamine B:DSPE-PEG-Biotin (77-X:1.5:1.5:X:0.1:0.1). Corresponding normalized intensity profiles of EGFP and Rhodamine B channels are plotted below.
(f) Corresponding normalized EGFP-cPHx1 liposome intensity from (e) across n=3 independent experiments (0%, 53 GUVs; 0.1%, 64 GUVs; 0.5%, 80 GUVs; 1.0%, 68 GUVs; 3.0%, 78 GUVs). Data are median, box (25th-75th) and whisker (5th-95th) percentiles of individual liposome measurements. Inset graph (red box) shows liposome measurements (background points) and paired trial averages (foreground points) from 0% and 0.1% PtdIns(3,4)P2-containing GUVs.
(g) GUVs treated for 30 min with dialysis buffer (control), SopBWT, or SopBWT(NEM) (enzyme pre-treated with a molar excess of NEM) were analyzed by confocal microscopy. Representative EGFP-cPHx1 localization is presented with normalized intensity profiles below. GUV compositions (mol %) were PtdCho:PtdSer:PtdIns(4,5)P2 or PtdIns(4)P:PtdEth-Rhodamine B:DSPE-PEG-Biotin (76.8:20:3:0.1:0.1).
(h) Quantification of (g) from n=5 independent experiments per condition (Control, 177 GUVs; SopBWT, 185 GUVs; SopBWT(NEM), 147 GUVs; SopB(WT)) or n=4 independent experiments (PtdIns(4)P substrate, 130 GUVs). Data are median, box (25th-75th) and whisker (5th-95th) percentiles of individual liposome measurements. ****P < 0.0001. Source numerical data are available in source data.

