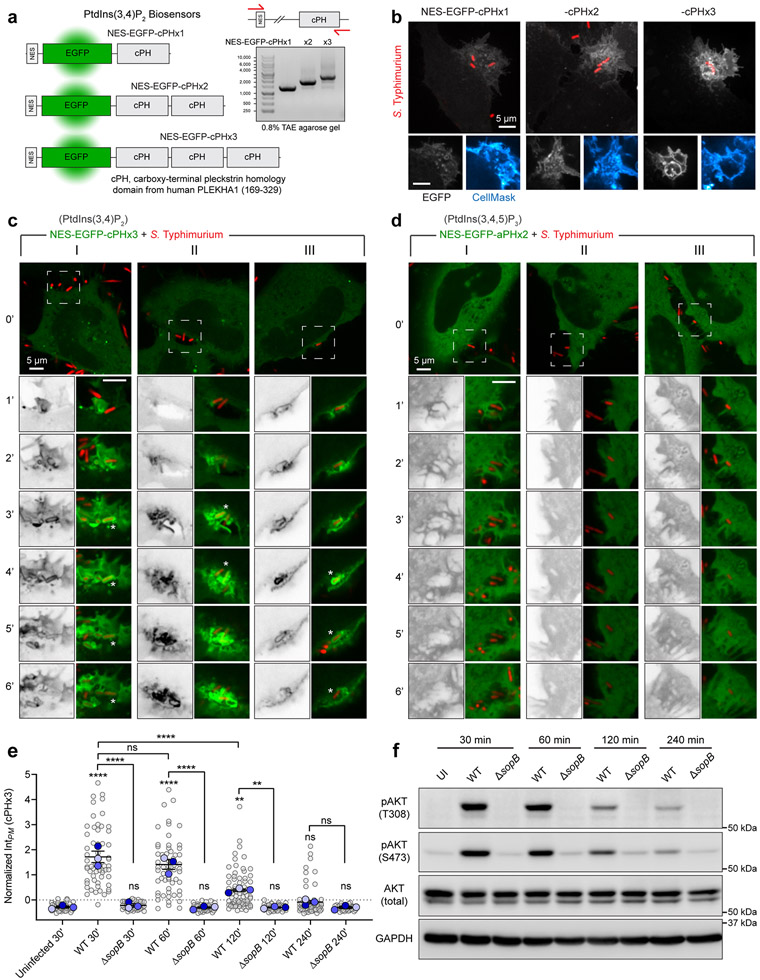
Extended Data Fig. 1. Rapid and sustained PtdIns(3,4)P2 synthesis during Salmonella entry and maturation.
(a) Model of PtdIns(3,4)P2 biosensors based on single, double-, or triple-tandem carboxy-terminal PH domains from TAPP1 (PLEKHA1). NES, nuclear export signal. Right, gel electrophoresis of PCR amplicons generated by primers that house the open reading frames.
(b) Cells expressing cPHx1, cPHx2, or cPHx3 were infected for 10 min with wild-type Salmonella prior to staining the PM with CellMask. Representative maximum intensity projections (main) and a corresponding confocal section of the invasion ruffle (bottom panels) are presented.
(c) Confocal imaging of cells (three examples in I, II, and III) expressing cPHx3 during invasion by wild-type Salmonella. Bottom vertical panels are expanded from the white box region and correspond to the minute-by-minute time series. cPHx3 is also presented in a gray inverted lookup table (RGB intensity 0=white, 255=black).
(d) As in (c), three examples (I, II, and III) of cells expressing the PtdIns(3,4,5)P3 sensor aPHx2 during invasion by wild-type Salmonella.
(e) Cells serum-starved for 3 h were infected by Salmonella. Extracellular bacteria were removed, and cells returned to serum-free medium containing gentamycin. PM cPHx3 intensities were quantified in the following number of cells: 59 (control), 60 (WT, 30 min), 42 (ΔsopB, 30 min), 58 (WT, 60 min), 53 (ΔsopB, 60 min), 75 (WT, 120 min), 48 (ΔsopB, 120 min), 66 (WT, 240 min), and 36 (ΔsopB, 240 min) across n=3 independent experiments. Data are trial means ± SEM (foreground) overlaid on cell measurements (background). Data from Fig. 1c are presented with ΔsopB infections. ****P < 0.0001; **P = 0.0054 (UI-vs-WT60), **P = 0.0044 (WT120-vs-ΔsopB120); ns, not significant.
(f) Cells serum-starved for 3 hours, were exposed to Salmonella (wild-type or ΔsopB) for 10 min. Extracellular bacteria were removed, and cells were returned to serum-free medium with gentamycin. Lysates were collected at the indicated time-points and analyzed on parallel membranes for pAKT (S473) or pAKT (T308) prior to stripping and re-probing for total AKT or GAPDH (loading control). Representative immunoblots are presented from n=2 independent experiments. UI, uninfected. Source numerical data and unprocessed blots are available in source data.

