
Fig. 1.
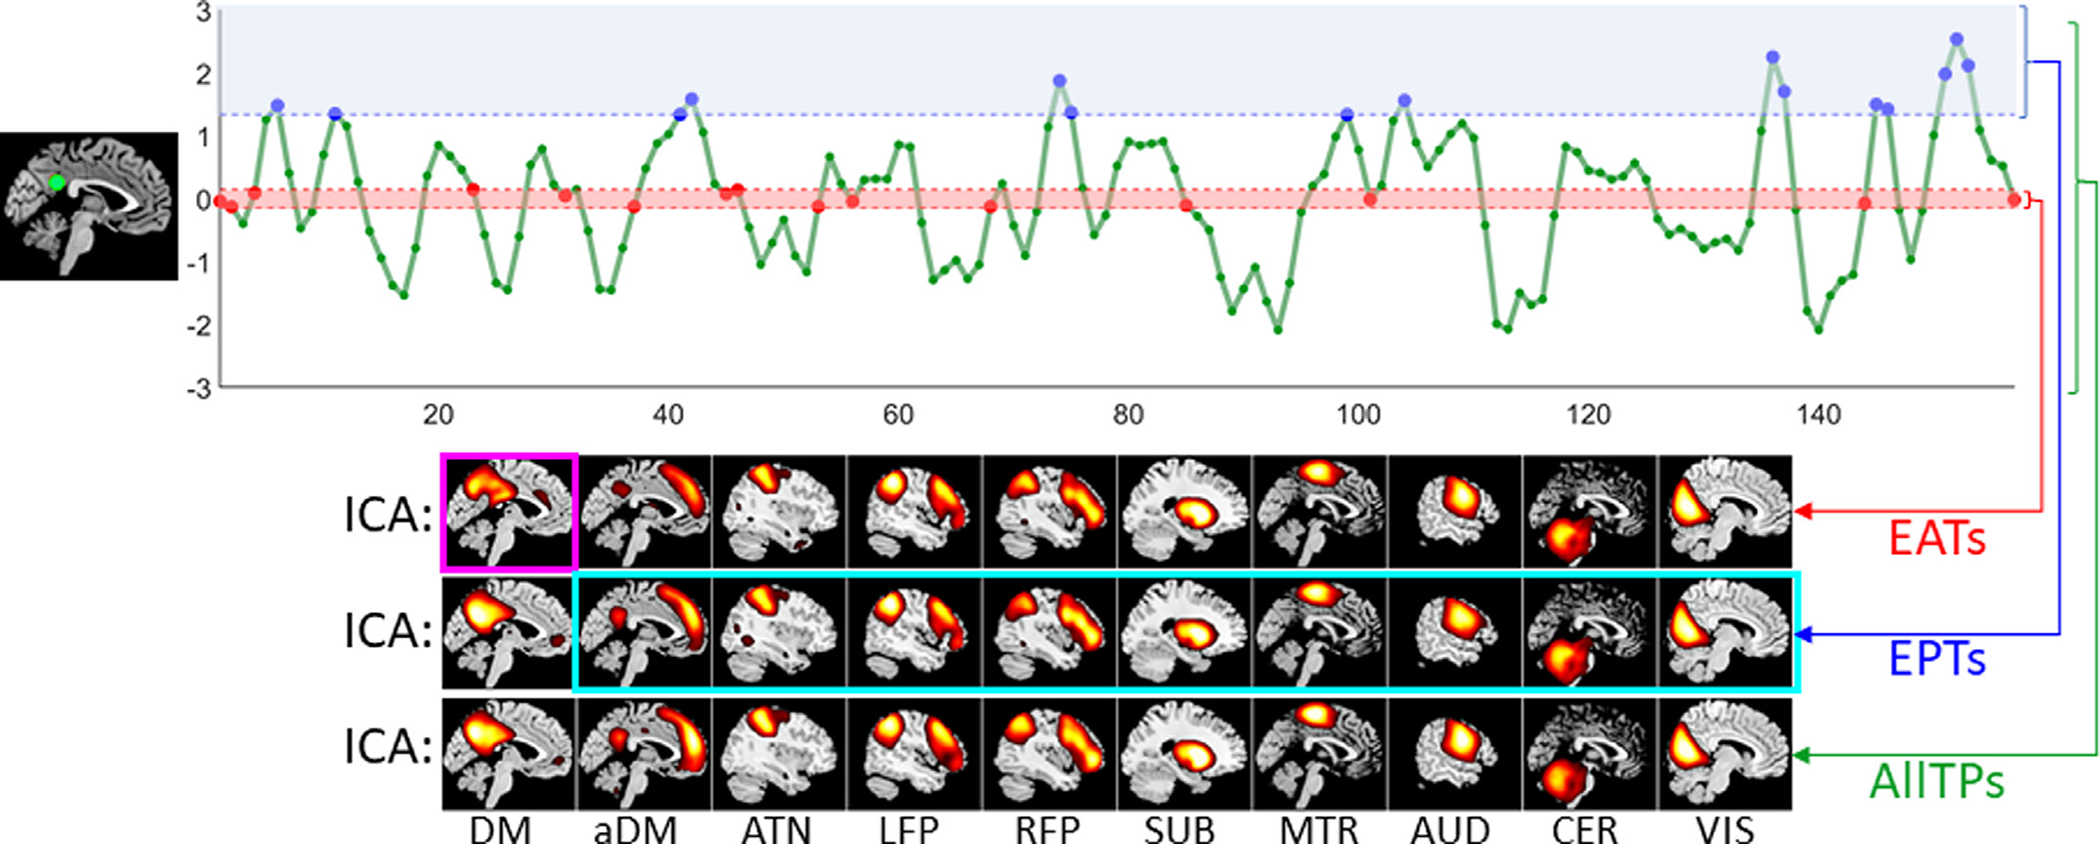
Schematic of the analysis pipeline. First, we select one of the four default mode nodes and use its time course to identify event present time points (EPTs) and event absent time points (EATs) for the default mode. The 20 time points with the largest amplitude are labeled as the EPTs (blue dots), while EATs are the 20 time points with minimum amplitudes (red dots). We selected this time point selection technique to minimize the likelihood of the presence of an event in EATs. We also repeated the analysis by using the amplitude of absolute value (as some studies use both positive and negative extremes as EPTs). We compared EPTs and EATs with the functional patterns obtain using all time points (AllTPs, green dots). We evaluated the presence of functional patterns in EATs, EPTs, and AllTPs of default mode (DM) using different tools, including high-order statistics using independent component analysis (ICA), presented in the figure, second-order statistics using pair-wise Pearson correlation, and first-order statistics using (weighted-) activation spatial maps (ASMs). We were specifically interested in whether (1) the DM is present within the EATs (magenta box) and (2) EPTs of the DM also include information about the non-DM networks (cyan box). aDM: anterior default mode network (as opposed to classical (posterior) DM), ATN: attention network, LFP/RFP: left/right frontoparietal network, SUB: subcortical network, MTR: Somatomotor network, AUD: auditory network, CER: cerebellar network, and VIS: visual network.