
FIGURE 1.
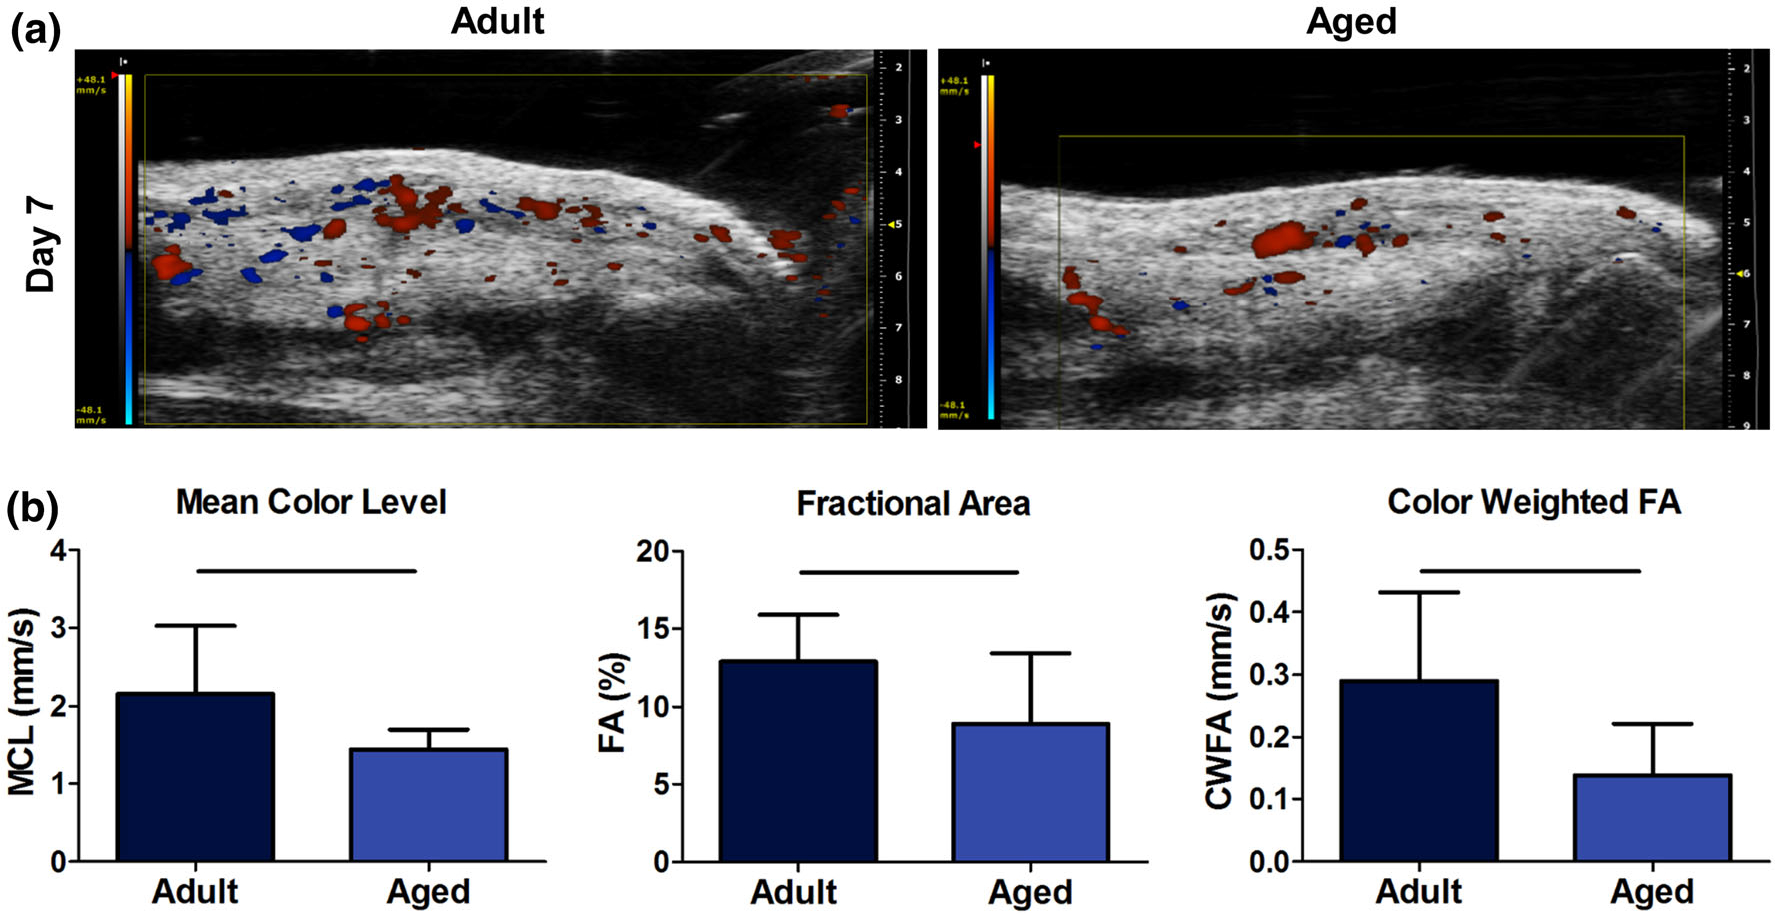
(a) Representative images for color Doppler ultrasound analysis. (b) Quantification of mean color level (MCL), fractional area (FA), and color weighted fractional area (CWFA). Solid bars indicate p < 0.05.
Official websites use .gov
A
.gov website belongs to an official
government organization in the United States.
Secure .gov websites use HTTPS
A lock (
) or https:// means you've safely
connected to the .gov website. Share sensitive
information only on official, secure websites.
(a) Representative images for color Doppler ultrasound analysis. (b) Quantification of mean color level (MCL), fractional area (FA), and color weighted fractional area (CWFA). Solid bars indicate p < 0.05.