
FIGURE 3.
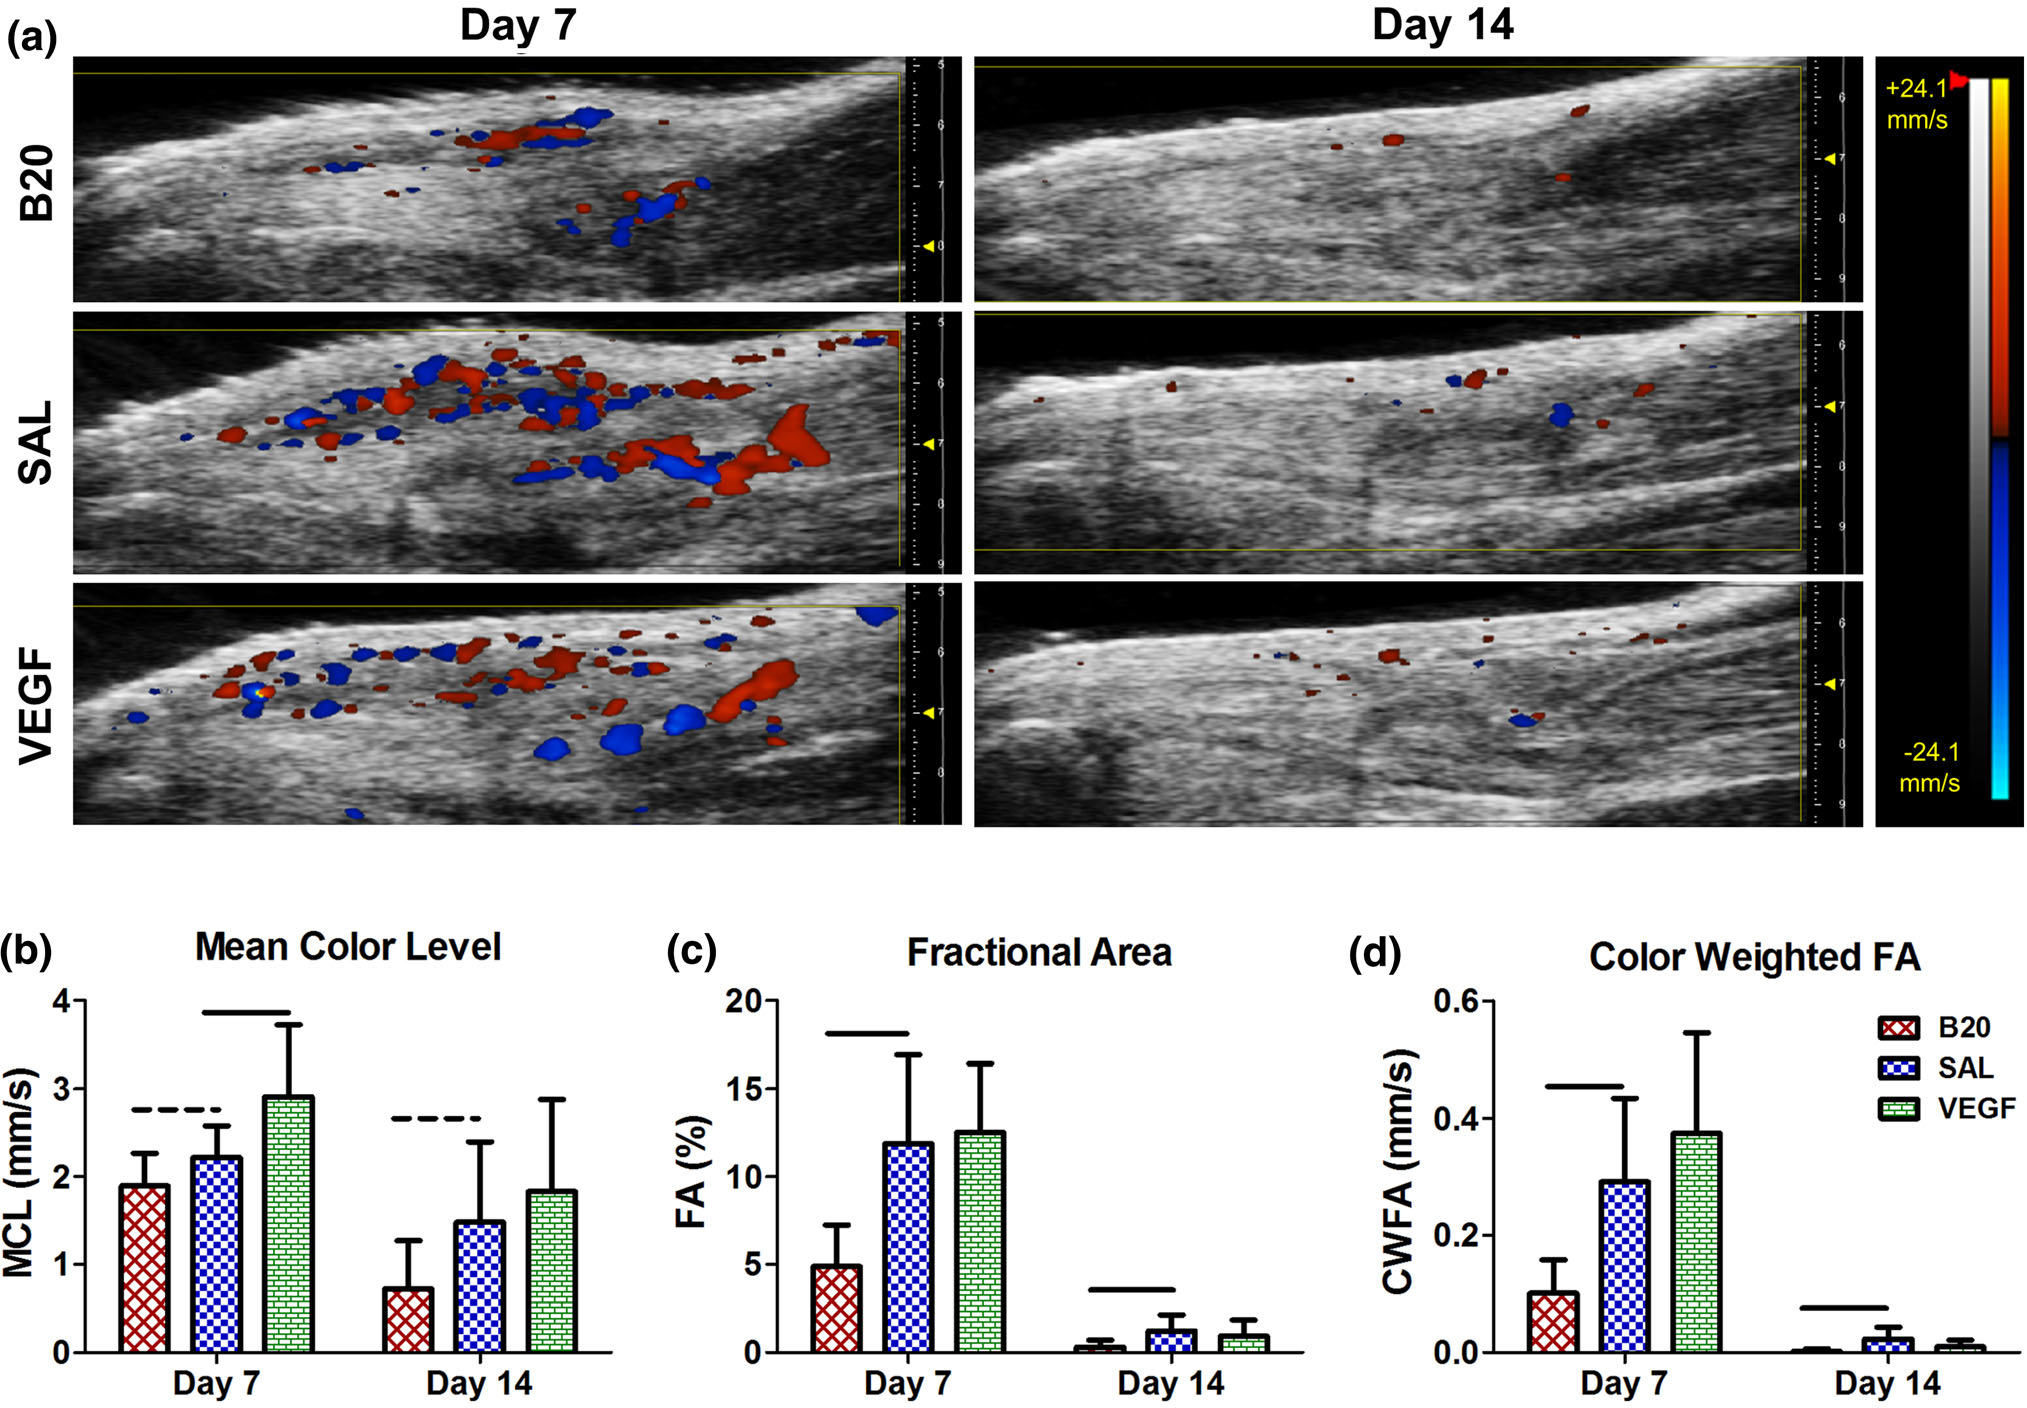
(a) Representative images of color Doppler ultrasound, where the red and blue color scale represents blood flow velocity towards and away from the transducer, respectively. Quantification of (b) mean color level (MCL), (c) fractional area (FA), and (d) color weighted fractional area (CWFA) in the full tendon ROI. The vascular endothelial growth factor group (VEGF) caused a significant increase in MCL at day 7, where the anti-VEGF antibody group (B20) caused trending or significant decreases in all three properties at multiple time points compared to the saline control (SAL). Solid bars indicate p < 0.05 and dashed bars indicated p < 0.1.