
FIGURE 4.
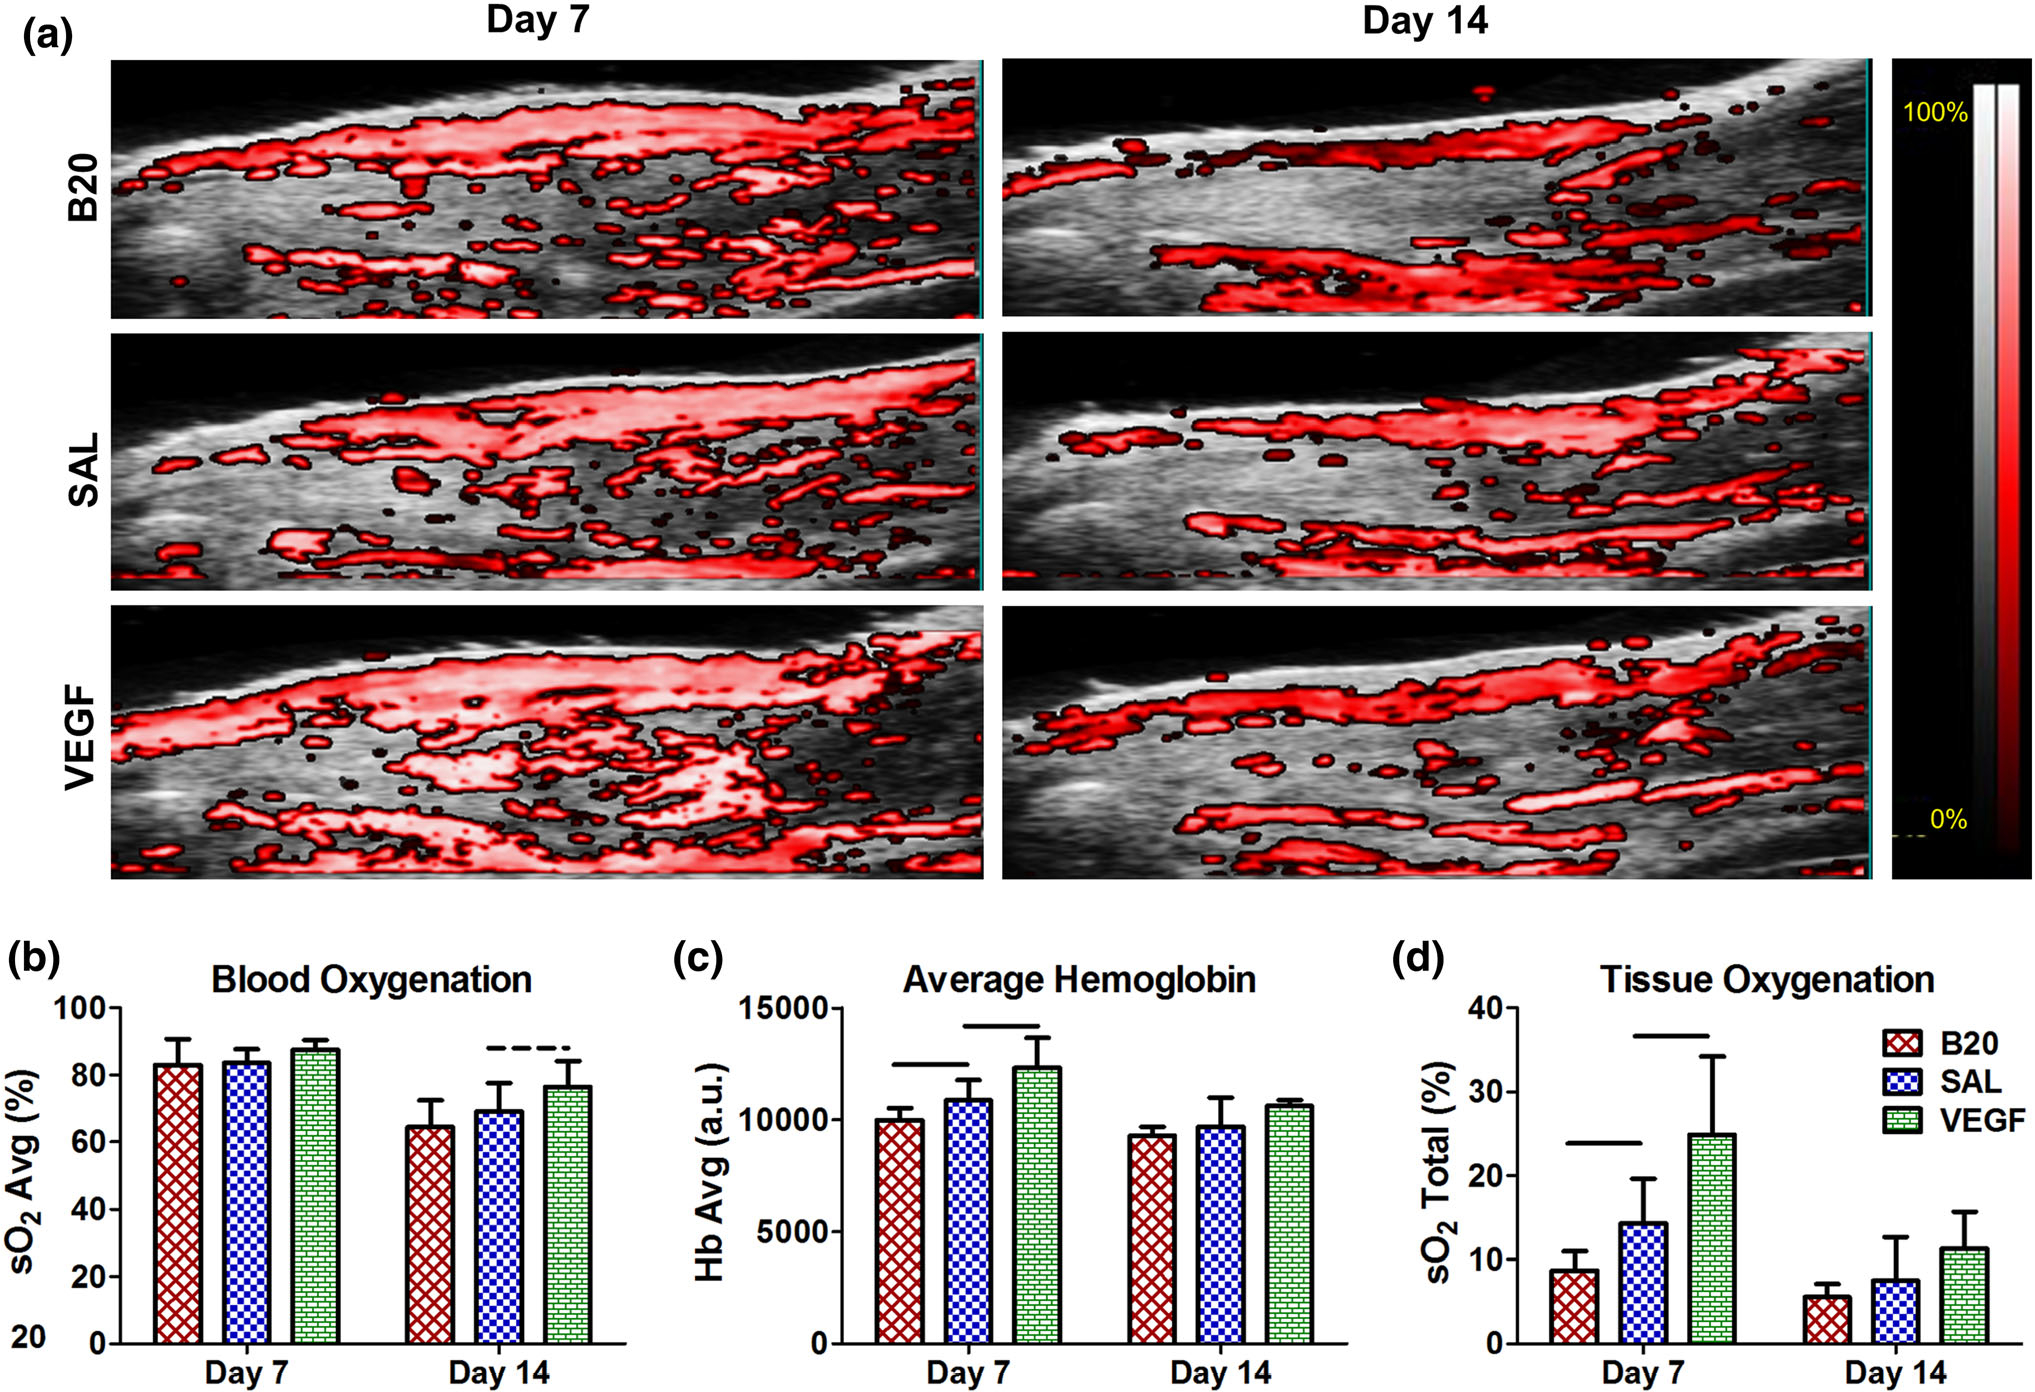
(a) Representative images of photoacoustic ultrasound, where the overlaid color scale indicates oxygen saturation of the detected hemoglobin. Quantification of (b) blood oxygenation (sO2 Avg), (c) average hemoglobin (Hb Avg), and (d) tissue oxygenation (sO2 Total) for the full tendon ROI. The vascular endothelial growth factor group (VEGF) caused significant or trending increases in all three parameters at multiple time points, where the anti-VEGF antibody group (B20) caused significant decreases in Hb Avg and sO2 Total at day 7 compared to the saline control (SAL). Solid bars indicate p < 0.05 and dashed bars indicate p < 0.1.