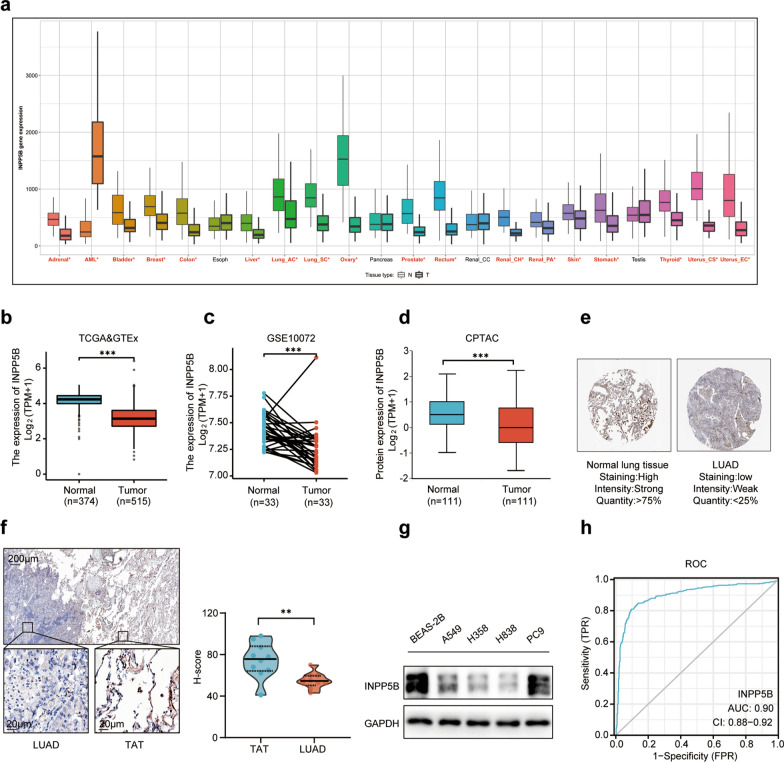
Fig. 1.
INPP5B expression in LUAD tissues at the mRNA and protein levels. a Differential expression of INPP5B in pan-cancer by RNASeq obtained from the TNMplot. Siginificant differences by Mann–Whitney U test marked with red*; black indicated no difference. b Expression of INPP5B in LUAD tissues (TCGA, n = 374) and healthy lung tissues (TCGA and GTEx, n = 515) by RNASeq. c Paired expression data for LUAD and adjacent normal tissues by RNASeq in GSE10072 dataset (n = 33). d The expression level of INPP5B total protein between normal tissue and primary tissue of LUAD based on the CPTAC dataset (n = 111). e Immunohistochemistry tissue microarray images of proteins INPP5B obtained from the HPA database. f Immunohistochemistry images of proteins INPP5B for LUAD tissue samples and tumor adjacent tissue (TAT). g Western blot analysis of INPP5B expression in BEAS-2B cells and four LUAD cell lines. *p < 0.05, **p < 0.01, ***p < 0.001. h ROC (Receiver operator characteristic curve) analysis of INPP5B in LUAD patients based on TCGA and GTEX data. AUC area under the curve

