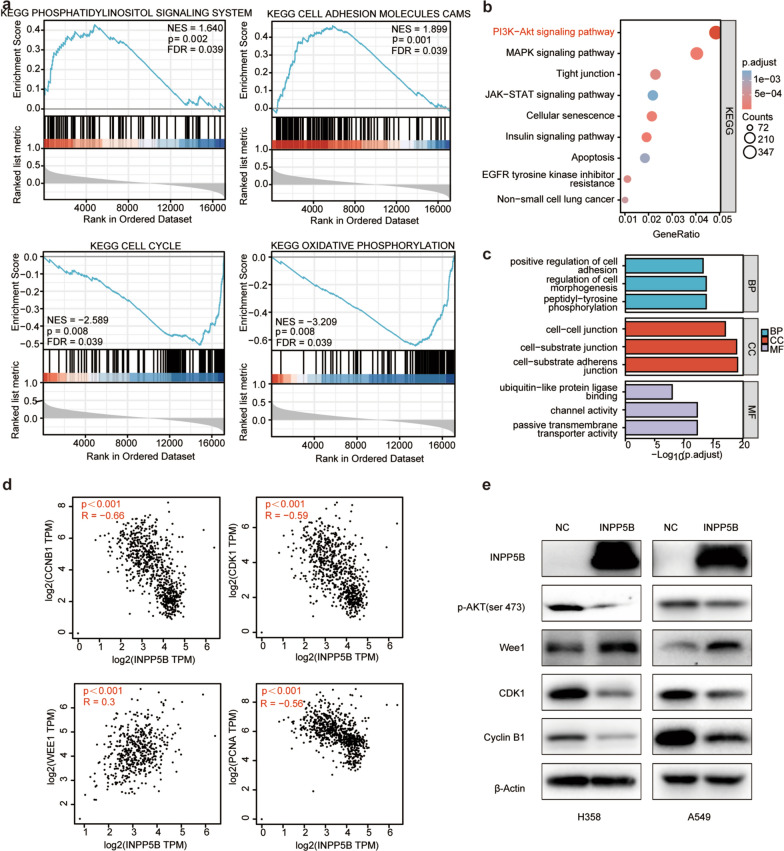
Fig. 4.
Pathway enrichment analysis of INPP5B. a Enrichment plots from GSEA. NES, normalized enrichment score of GSEA. p < 0.05 and FDR < 0.25 were considered statistically significant for GSEA. b KEGG signaling pathway enrichment analysis. c Gene ontology analysis included biological process (BP), molecular function (MF), and cellular component (CC). d The expression relationship between INPP5B expression and cell cycle-related genes. e Western blot analysis validation of AKT signaling pathway in LUAD cell lines. Experiments were repeated three times, and data from a representative experiment are shown

