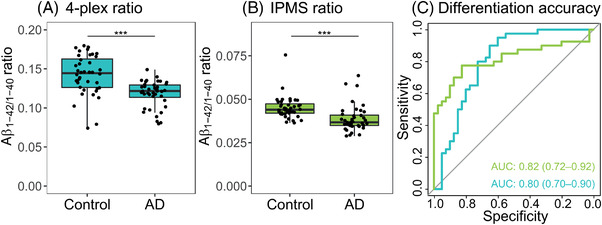
FIGURE 2.

Differentiation accuracy of amyloid markers in CSF amyloid negative controls and CSF amyloid positive AD patients. A, The Aβ1‐42/1‐40 ratio measured with the Simoa 4‐plex. B, The Aβ1‐42/1‐40 ratio measured with IPMS. C, ROC curves of the two plasma amyloid marker for differentiation between control and AD (in blue: Simoa; in green: IPMS). There was no difference in accuracy between the two ratios. Aβ, amyloid beta; AD, Alzheimer's disease; AUC, area under the curve; CSF, cerebrospinal fluid; IPMS, immunoprecipitation mass spectrometry; ROC, receiver operating characteristic
