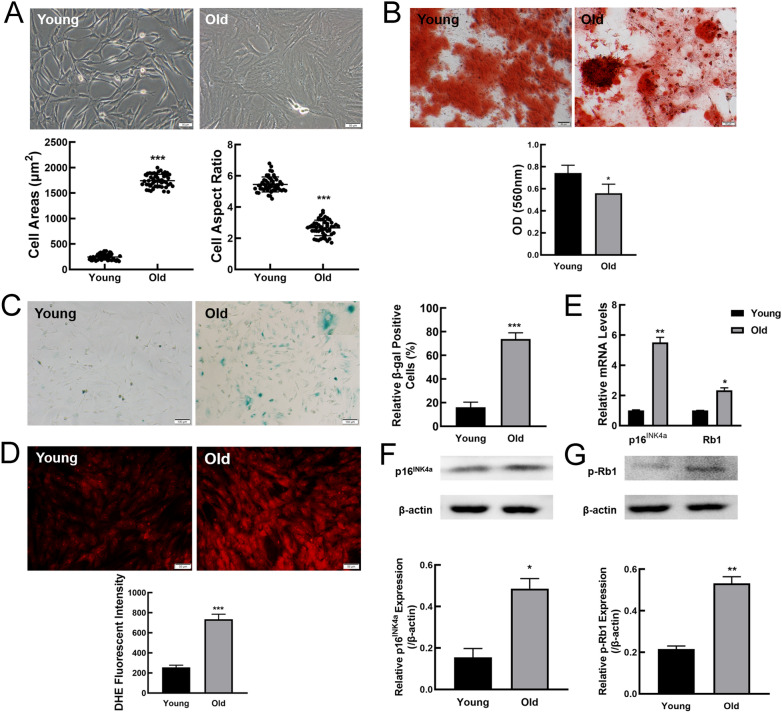
Fig. 1.
Accelerated ageing phenotypes in MSCs from old rats. A Representative bright-field images showing the morphology of MSCs from young and old rats and analysis of cell aspect ratio and cell surface area. Scale bar, 50 µm. B Determination of osteogenic differentiation in MSCs from young and old rats by Alizarin Red S staining (scale bar = 50 μm). C SA-β-gal staining and the percentages of SA-β-gal-positive cells. Scale bar, 100 μm. D Intracellular ROS levels and statistical analysis of ROS fluorescent intensity. Scale bar, 50 μm. E The expression of senescence marker genes at mRNA levels by RT-qPCR. F, G Western blot was performed to examine p16 INK4a and phospho-Rb1 protein expression levels. β-actin was used as a loading control. All data were presented as mean ± SEM (error bars), n = 3, ***P < 0.001, **P < 0.01, * P < 0.05

