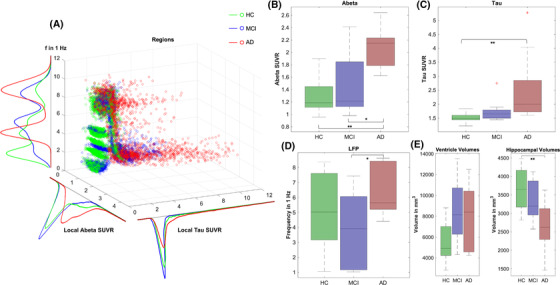
FIGURE 3.

Characteristics of empirical feature space. In (A), regional distributions of Aβ, tau, and LFP frequency are shown for all groups in a 3D scatterplot. Red data points symbolize regions of AD patients, green points MCI patients, and blue points HC. Each scatters point stands for one region of one subject. Color density is normalized between groups. A kernel density estimate of the corresponding histograms is shown (projection of the 3D plot to one axis). In particular, it can be seen a string of outliers with very high tau values in the AD group and in parts in the MCI group, which does not appear for HC. Moreover, AD participants’ regions show higher Aβ values, in particular for lower frequencies. Besides, boxplots are presented for groupwise comparisons for the features mean Aβ per subject, mean tau per subject, mean simulated LFP frequency per subject, and mean volume per subject. A Kruskal–Wallis test was performed to assess significance: * marks significance with P < 0.05; ** marks significance after Bonferroni‐correction with P < 0.003 (for 15 tests). B, Aβ SUVR is significantly different between AD and HC (P = 0.002) and MCI (P = 0.045), but not between HC and MCI (P = 0.811). C, Tau SUVR is only significantly different between AD and HC (P < 0.001), but not between AD and MCI (P = 0.174) or HC and MCI (P = 0.267). D, LFP frequency is only significantly different between AD and MCI (P = 0.032), but not between AD and HC (P = 0.216) or HC and MCI (P = 0.472). E, As the mean volume of all regions (including, e.g., ventricles and white matter) does not show significant differences (as expected because of volume shifts between parenchyma and CSF). We explored the data regarding ventricle enlargement 39 and hippocampal atrophy. 40 Although we see a tendency for both in the AD group, only the difference in hippocampal volume reaches significance between AD and HC. Ventricle volumes: HC and MCI (P = 0.056), HC and AD (P = 0.116), MCI and AD (P = 0.910). Hippocampal volumes: HC and MCI (P = 0.556), HC and AD (P = 0.003), MCI and AD (P = 0.144). Aβ, amyloid beta; AD, Alzheimer's disease; CSF, cerebrospinal fluid; HC, healthy controls; LFP, local field potential; MCI, mild cognitive impairment; MRI, magnetic resonance imaging; PET, positron emission tomography; PSP, postsynaptic potential; SC, structural connectivity; SUVR, standardized uptake value ratio
