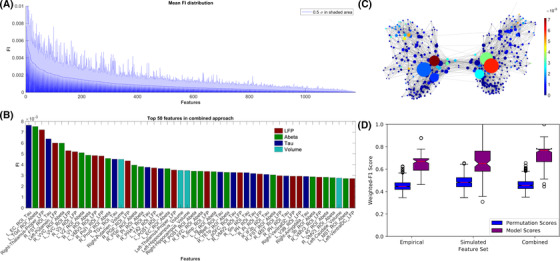
FIGURE 5.

Feature importance (FI) distribution. A, Mean random forest (RF)‐derived feature importance from 100 outer cross‐validation runs. Entropy criterion with combined feature types shown here. Feature importance values are normalized, so all features sum to one. In shaded blue, half standard deviation is displayed for each feature. B, Top 50 features across all cross‐validation runs. Both empirical (tau in dark blue, amyloid beta [Aβ] in green, volume in light blue), as well as simulated frequencies (red), contributed to the improved classification. Many features seem moreover to be biologically plausible in the context of Alzheimer's disease (AD), as, for example, tau in entorhinal cortex (Braak stage 1), 41 thalamic dysfunction (as significant rhythm generator), 42 and volumes in hippocampus (as signs of atrophy). 40 C, Visualization of the structural connectivity (SC) graph with color indicating FI of the regional local field potential (LFP) frequencies, while vertex diameter reflects the structural degree. It shows a network dependency of the LFP FI. Only edges with connection strength above the 95th percentile are shown. D, The distributions of weighted F1 scores for permutation based null model (left box) and corresponding true model (right box). All models significantly outperform the null model with the combined model showing the greatest average distance to its null model, indicating the gain in differentiating information
