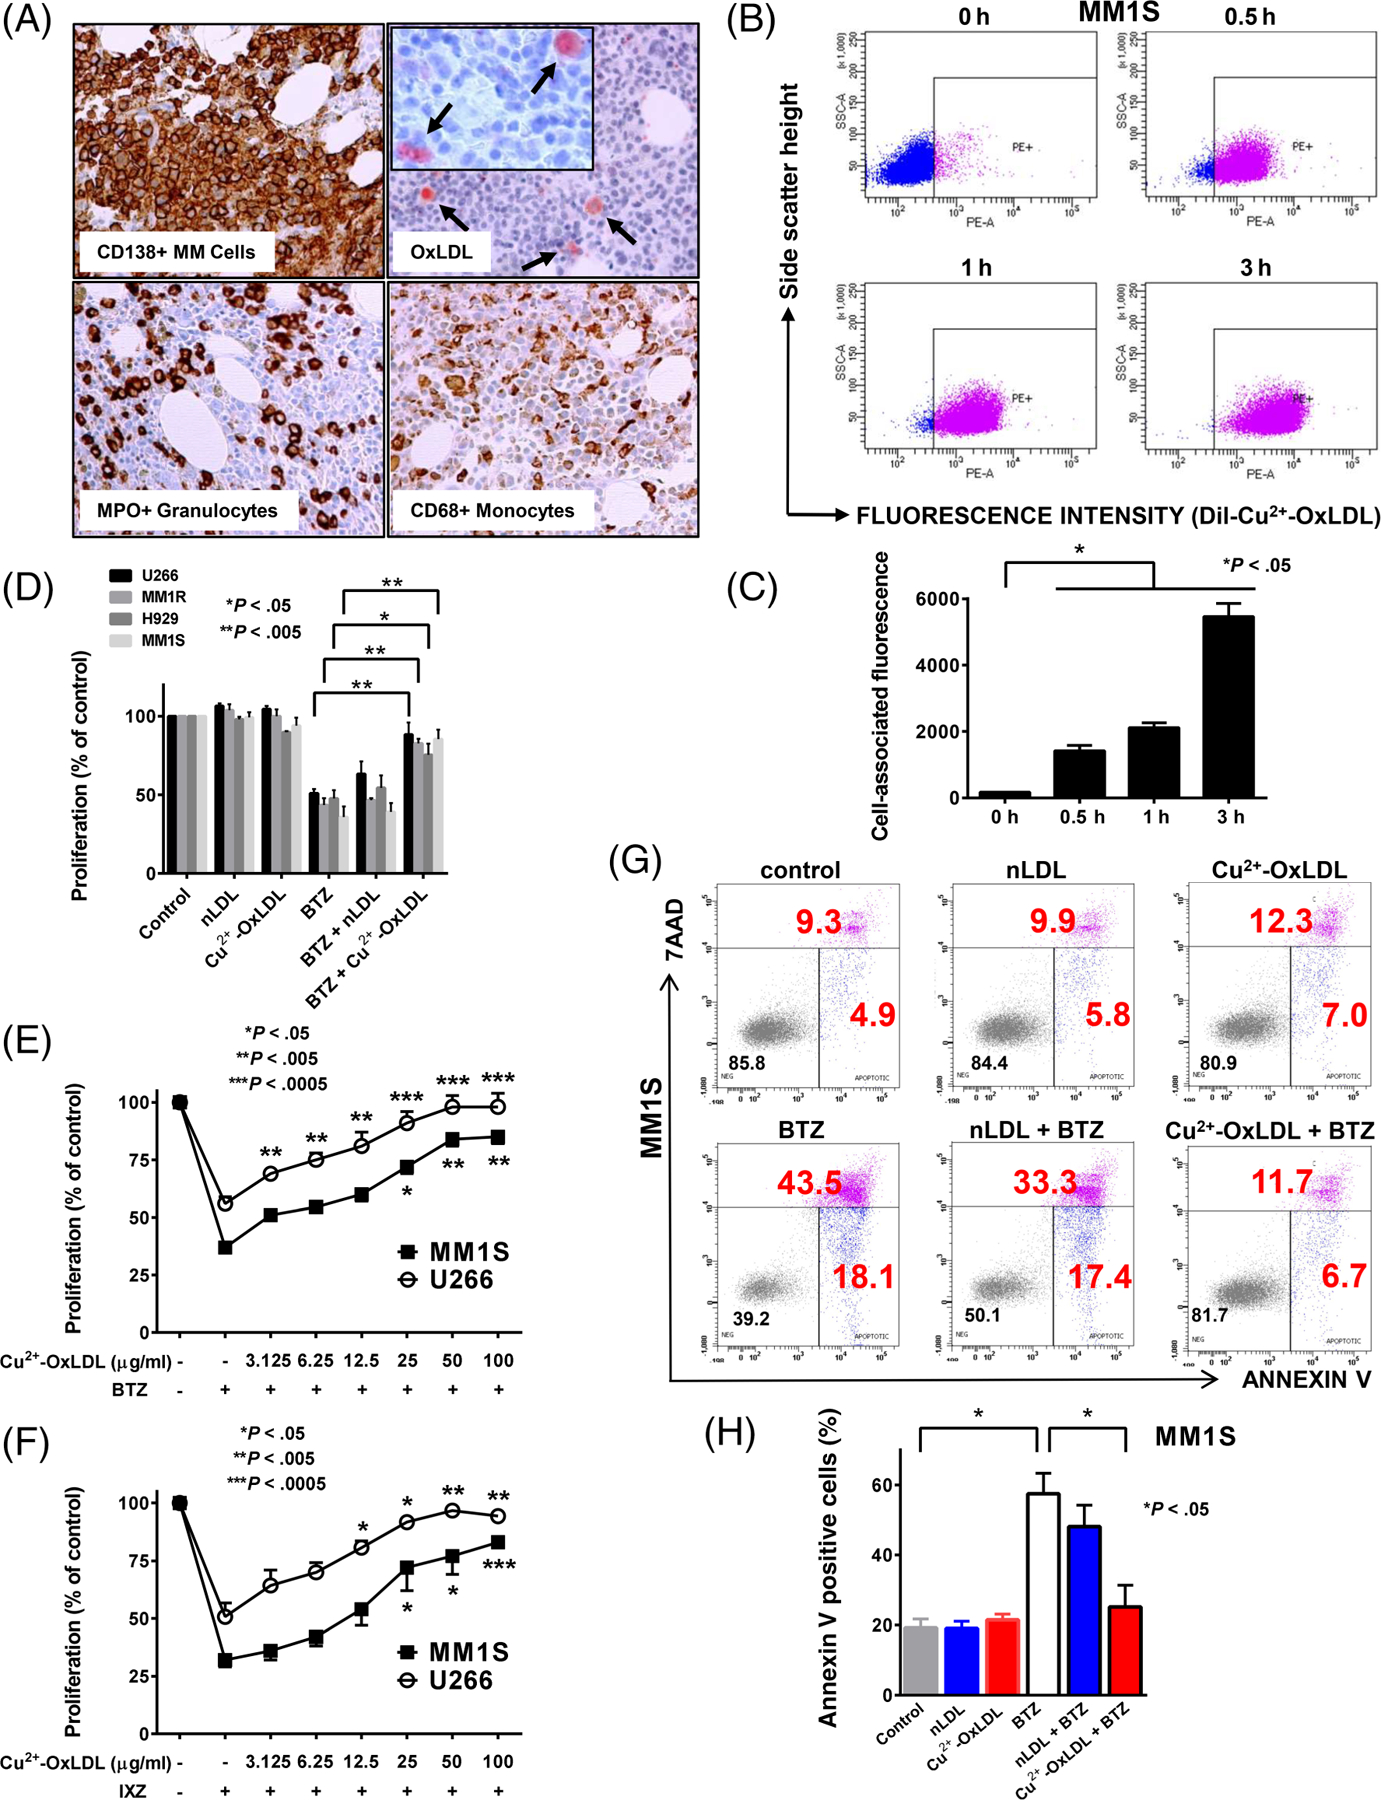
FIGURE 1.

OxLDL is present in the MM microenvironment, associates with MM cells and suppresses the anti-MM effects of bortezomib and ixazomib. A, Immunohistochemical analysis of a bone marrow specimen from a patient with newly diagnosed MM for CD138, OxLDL, myeloperoxidase (MPO) and CD68. B, Representative plot of flow cytometric analysis of DiI-Cu2+-OxLDL association with MM1S cells incubated with 1 μg/mL DiI-Cu2+-OxLDL for 0 to 3 hours. The mean fluorescence of a 35 000 cell population was evaluated. C, Data are expressed as the mean ± SE of cell-associated fluorescence for three independent experiments. D, Proliferation of U266, MM1R, H929 and MM1S cells exposed to 6 nM bortezomib (BTZ) for 48 hours in the presence of 50 μg/mL native LDL (nLDL) or Cu2+-OxLDL. Proliferation of MM1S and U266 cells exposed to 6 nM BTZ (E), or 80 and 100 nM ixazomib (IXZ), respectively (F), for 48 hours in the presence of increasing concentrations of Cu2+-OxLDL. Proliferation in (D-F) was assessed by MTS assay. Data are expressed as the mean ± SE of the % of control from three independent experiments performed in quadruplicate. G, Representative plot of flow cytometric analysis of the percentage of apoptotic (Annexin V positive highlighted in red) cells by Annexin V and 7-ADD staining following exposure of MM1S cells to 6 nM BTZ for 24 hours in the presence of 50 μg/mL nLDL or 50 μg/mL OxLDL. (H) Data are expressed as the mean ± SE of the percentage of Annexin V-positive cells for three independent experiments
