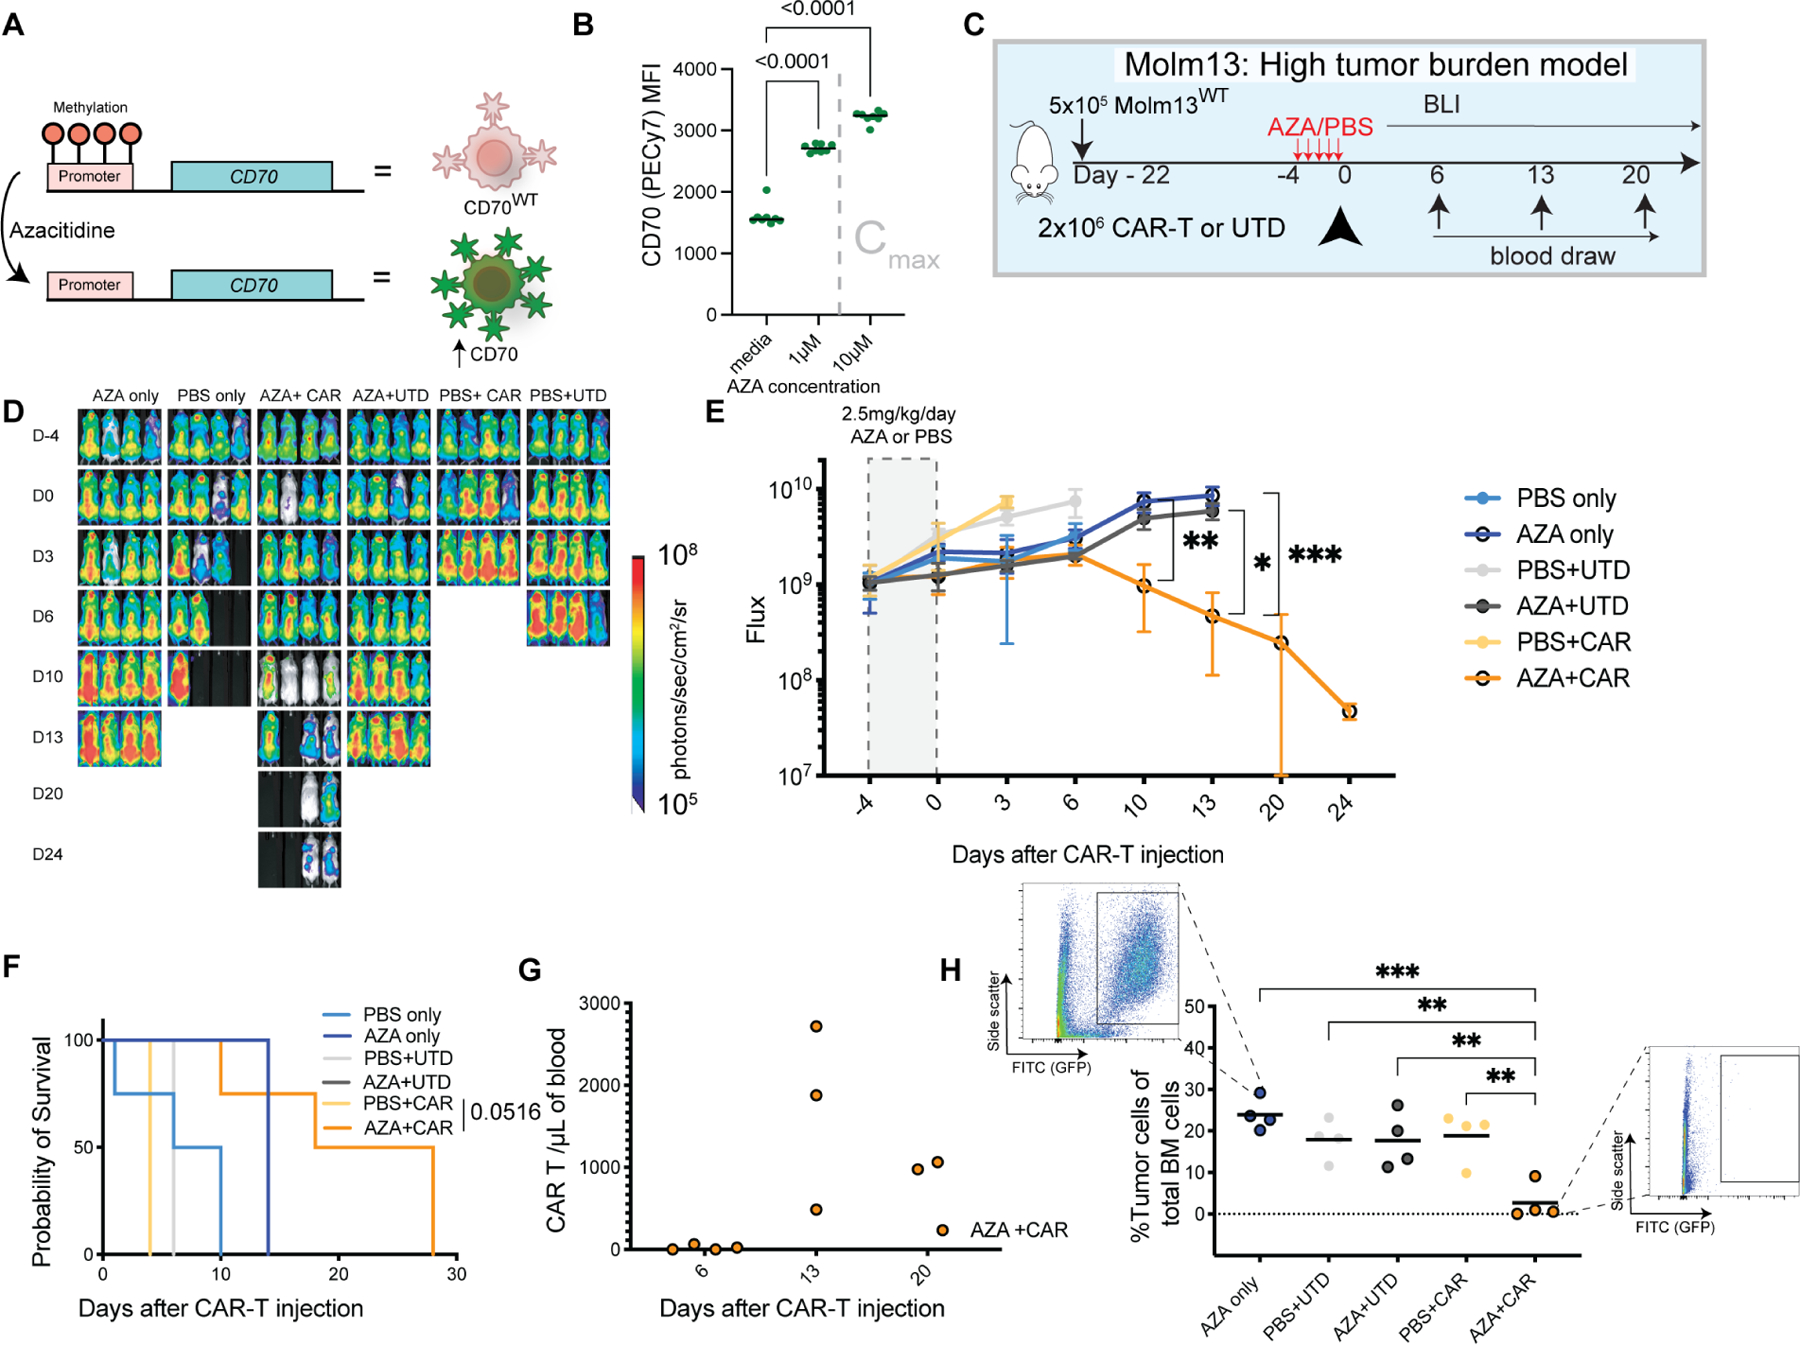
Figure 2. Azacitidine augments CD70-CAR potency by increasing antigen expression on AML blasts in a high tumor burden model.

(A) Mechanism of CD70 antigen increase after CD70 expression (Riether et al., 2020). (B) CD70 expression levels by flow cytometry after Molm13 exposure to the indicated concentrations of azacitidine for 72 hours. Gated on live (DAPI-) cells. Cmax represents the maximal concentration in humans after a single dose of 75mg/m2 (Actavis_Pharma). Representative of n=3 independent experiments. Horizontal lines represent the median. (C) Experimental setup: NSG mice were injected with 5×10⁵ Molm13 on day −22 (n=4 mice per group). After prolonged tumor engraftment and randomization, mice received intraperitoneal injections of 2.5mg/kg/day azacitidine or vehicle (PBS) starting on day −4. On day 0 they were treated with either: no intervention, a single dose of 2 ×10⁶ native CD70-targeted CAR-T-cells, or the equivalent number of untransduced T cells (UTD). (D) BLI of AML xenografts over time in the indicated groups. (E) Quantification of flux [photons/second] in the experimental groups at the indicated time points. Points represent mean ± SEM. * p< 0.05, ** p<0.01, *** p<0.001 by mixed effect model and Dunnett’s correction for multiple hypotheses. (F) Kaplan-Meier survival curves of the treatment groups. P-value as shown for AZA+CAR comparison to PBS+CAR control p by Log-rank (Mantel-Cox) test with Bonferroni correction. (G) Quantification of CAR-T-cells (CD3+ BFP+) measured in the peripheral blood by flow cytometry at the indicated time points. (H) Percentage of GFP positive cells in the femur at the time of death or euthanasia as assessed by flow cytometry gated as shown which were representative of the identified conditions. Bars represent the mean. ** p< 0.01, *** p< 0.001 by one-way ANOVA with Dunnett’s correction for multiple hypotheses to the AZA+CAR condition. Representative of n=2 independent experiments.
See also Figure S3.
