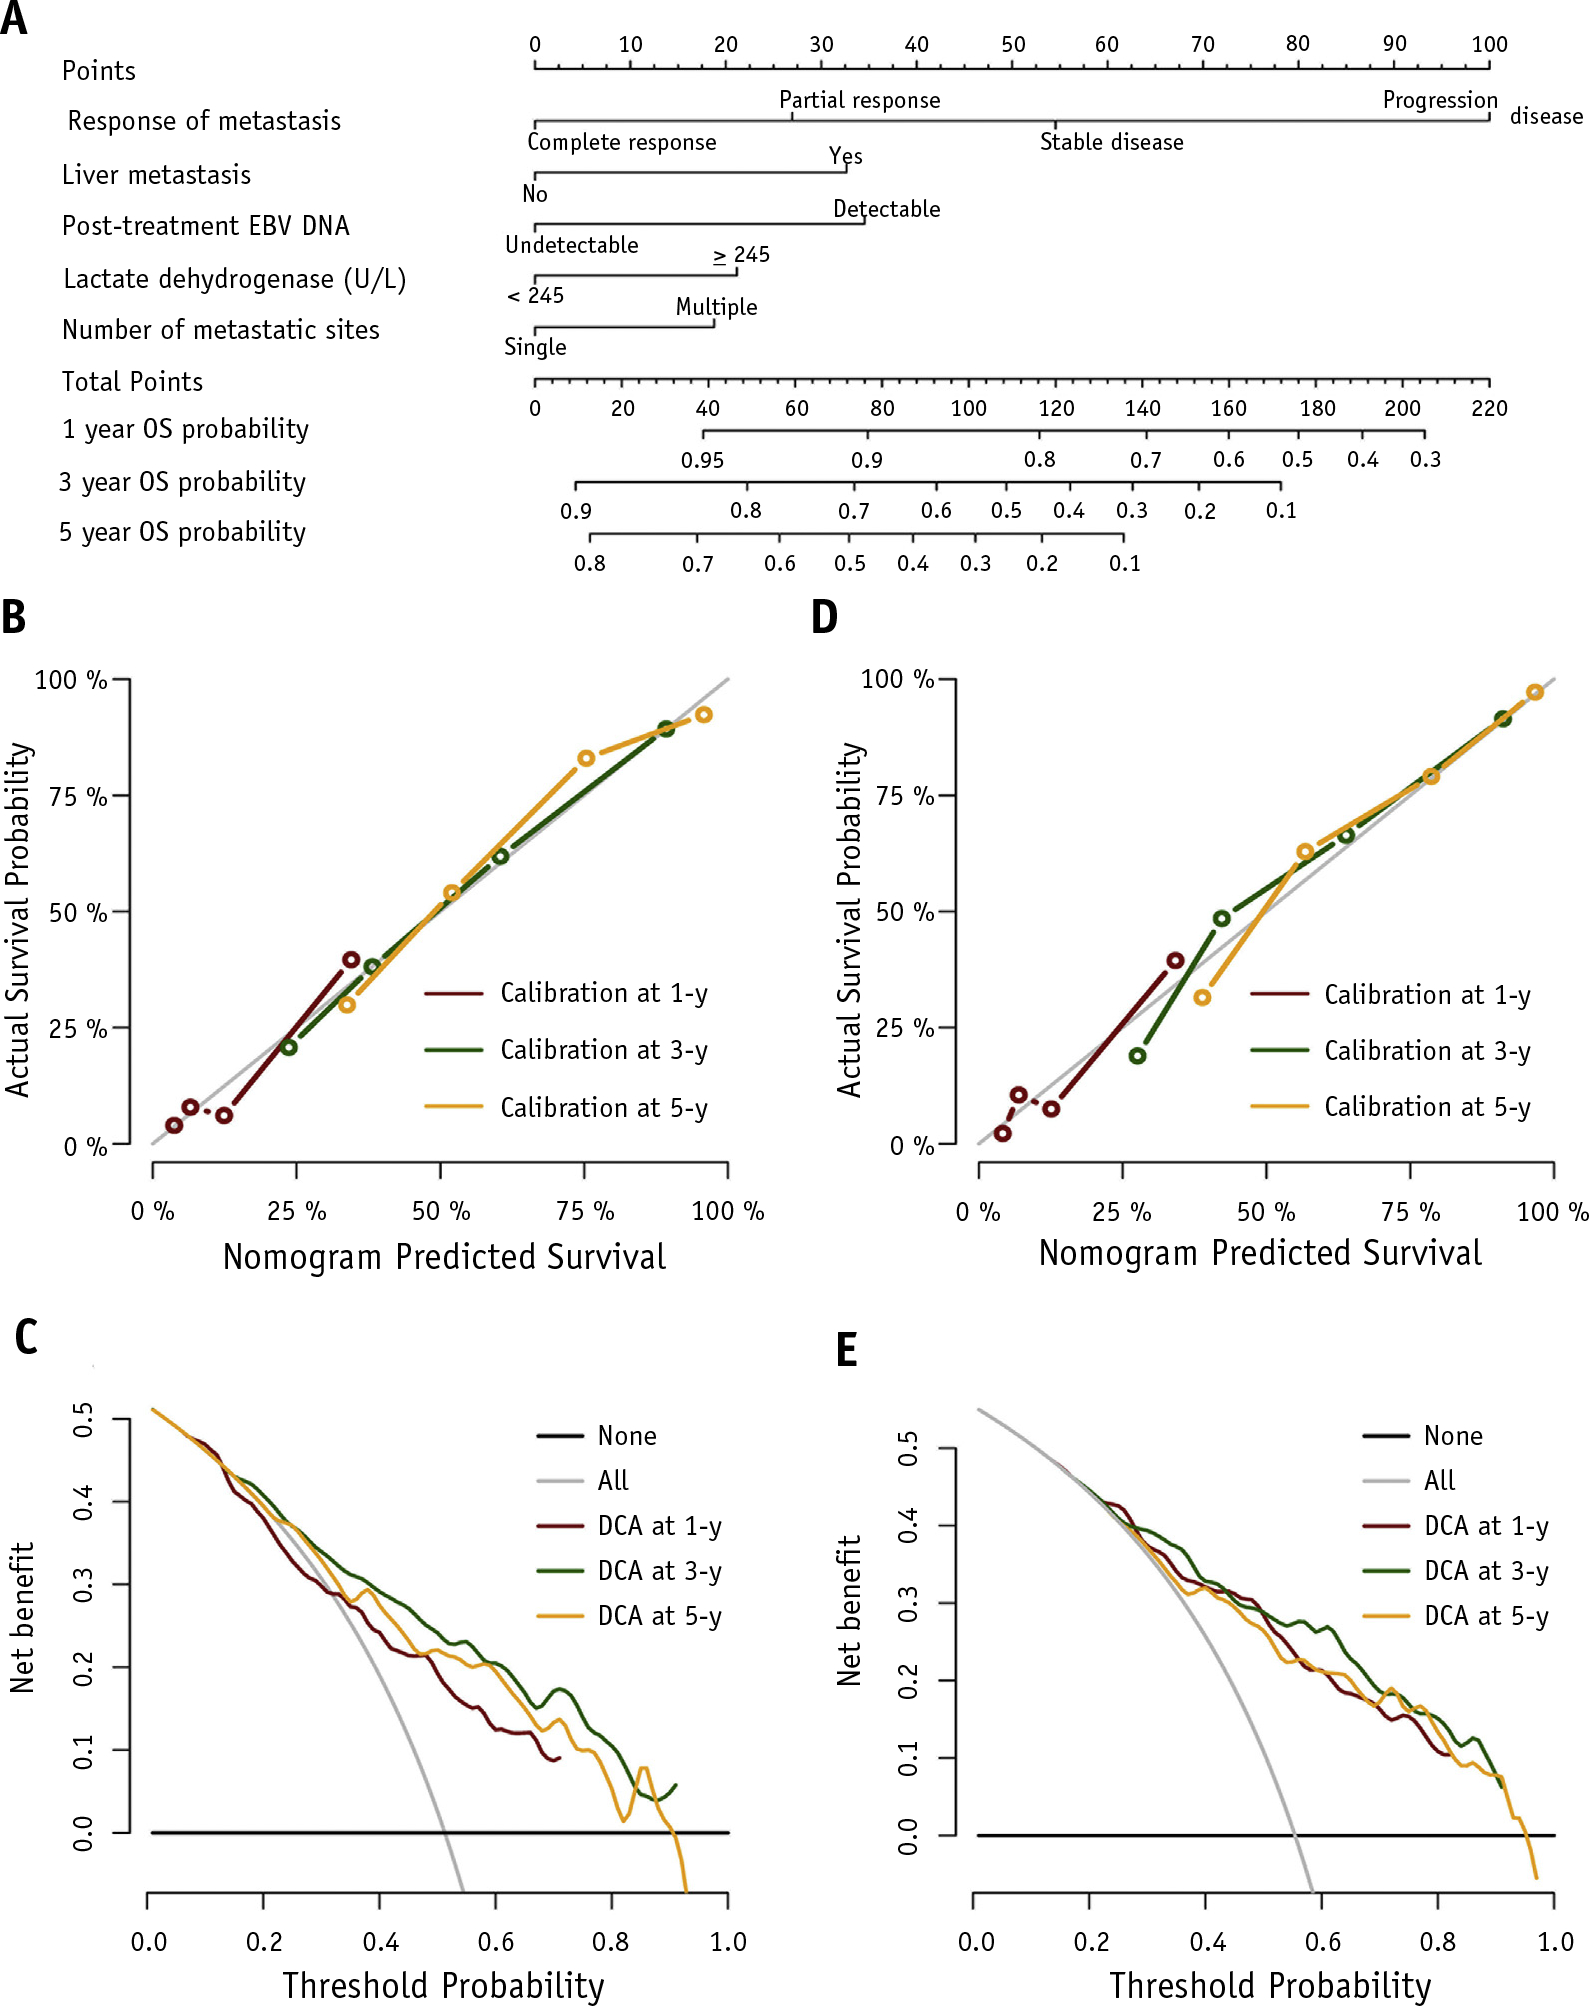
Fig. 3.

(A) Nomogram-based prognostic model for the prediction of 1-, 3-, and 5-year overall survival. To use the nomogram, draw an upward vertical line from a variable value to the points bar to determine points that correspond to that variable value. Then sum up the points from each variable value to get the prognostic score. Based on the sum, draw a downward vertical line from the total points line to calculate overall survival probability. The calibration plots at 1, 3, and 5 years in the (B) training and (D) validation cohorts. The decision curve analyses at 1, 3, and 5 years in the (C) training and (E) validation cohorts.
