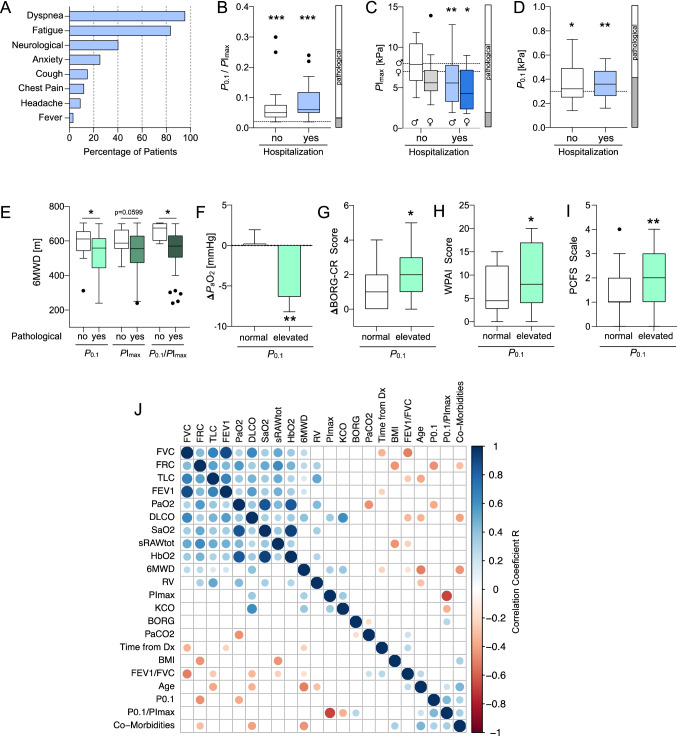
Fig. 1.
Respiratory muscle impairment after COVID-19 is associated with impaired exercise tolerance, exercise-induced deoxygenation, activity and functional outcome A Persisting symptoms of convalescent COVID-19 patients at the time of presentation to the outpatient department (OPD) (mean: 152 days after diagnosis, Dx, n = 67). B Respiratory muscle strain P0.1/PImax at OPD presentation after COVID-19 by hospitalization status of acute COVID-19 (***p = 6.0E−08 and ***p = 5.8E−11, respectively; one-sample Wilcoxon test versus upper limit of normal cutoff: 0.02). C Inspiratory muscle strength PImax by sex and hospitalization status (nonhospitalized: male (♂), p = 0.83 and female (♀), p = 0.10; hospitalized: male, **p = 0.0079; female, *p = 0.0269; one-sample Wilcoxon versus cutoff: 8 kPa, male and 7 kPa, female). Fractions of sex- and age-corrected pathological test results are given in the adjacent vertical bar. D Airway occlusion pressure at 0.1 s, P0.1 per same patient as in (B) (*p = 0.0291, **p = 0.0027, one-sample t test versus cutoff: 0.3 kPa) and fraction of pathological test results (adjacent bar). E Six-minute walking test (6MWT) distance (6MWD) in meters (m) by P0.1 (*p = 0.0219), PImax (p = 0.0599) and P0.1/PImax (p = 0.0162), Mann–Whitney test. F Difference in arterial partial pressures for oxygen (ΔPaO2) by P0.1 (**p = 0.0134, unpaired, 2-sided t test) G Difference in self-reported dyspnea perception (BORG-CR score) at rest and immediately after 6MWT by P0.1 (ΔBORG-CR, *p = 0.0299, Mann–Whitney test). H Self-reported activity and productivity impairment (modified WPAI score) in the last seven days before presentation to the OPD by P0.1 (*p = 0.0471, Mann–Whitney test). I Self-reported Post-COVID-19 Functional Status (PCFS) scale at the time of presentation to the OPD by P0.1 (**p = 0.0058, Mann–Whitney test). J Multivariate matrix of significantly (p < 0.05) correlated variables from the study cohort (Pearson or Spearman R values) sorted by first principal component. Box-and-whiskers showing medians + interquartal range (IQR) and outliers (Tukey method). In F, normally distributed data are given as mean ± standard error of the mean. Dashed lines in G, H and I represent pathological (sex-specific) cutoff values. Mann–Whitney test in F, G, H and I was used for comparison of groups with normal vs. elevated P0.1.Vertical bars in B, C and D represent the fraction of pathological (open) and normal (gray) values from the total cohort

