
FIGURE 3.
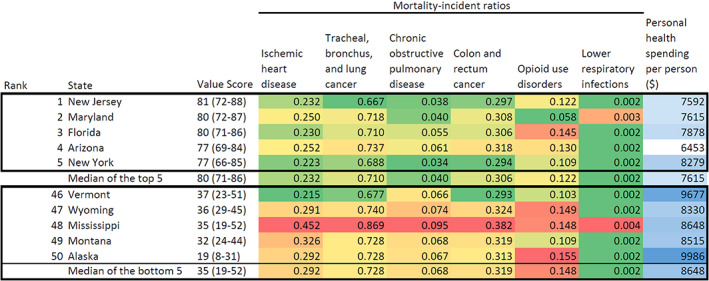
Health system value, mortality‐incidence ratio, and health care spending for the US states with the highest and lowest value, 2014.Notes: This figure shows estimates of US health care delivery system value, unadjusted mortality incidence ratios, and health care spending in 2014 [Color figure can be viewed at wileyonlinelibrary.com]