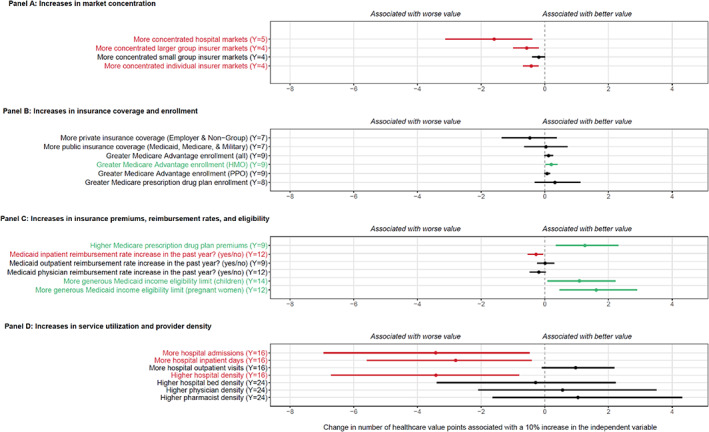
FIGURE 5.

The association between health care value and health system characteristics and policies.Notes: Estimated coefficients are each from a separate bivariate, log‐linear regression, with the 95% confidence interval shown, representing the difference in health care value associated with a 10% increase in the health care system characteristic or policy. US state fixed effects were also included in order to estimate the association between changes in health system characteristics and policies with changes in health care value, for each US state. Number of years of data availability are listed for each variable. Green font indicates characteristics positively associated with value and statistically significant (alpha = 0.05), while red font indicates characteristics negatively associated with value and statistically significant [Color figure can be viewed at wileyonlinelibrary.com]
