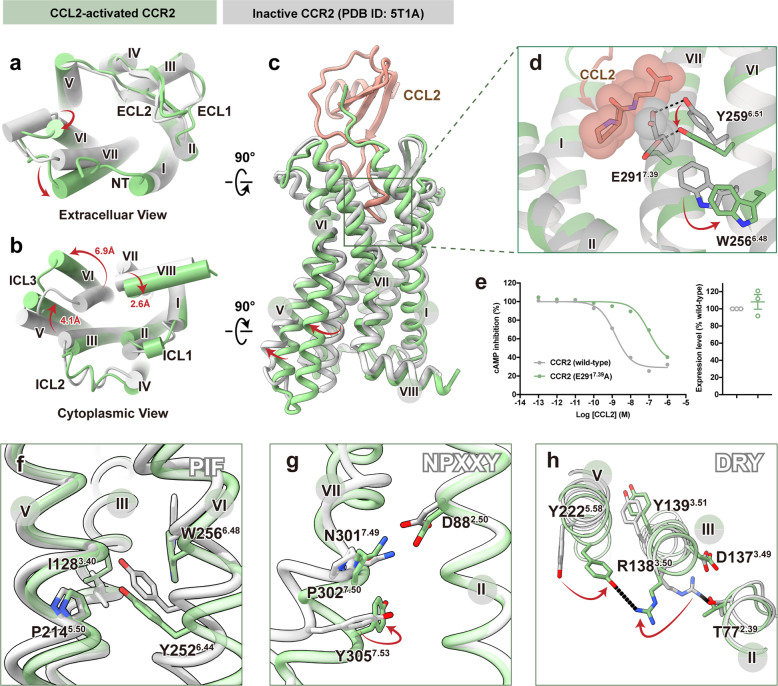
Fig. 3. Molecular basis for activation and G-protein coupling of CCR2 induced by CCL2.
a–c Extracellular (a), cytoplasmic (b), and side view (c) of CCL2-bound CCR2 (green, active state) superimposed on the inactive CCR2 (gray, PDB: 5T1A). d Close-up view of the orthosteric binding pocket in CCR2. The N-terminal residues of CCL2 (brown) and E2917.39 (gray) of inactive CCR2 are shown as spheres. e Dose-response curves for CCL2-induced Gi signaling on CCR2 (wild-type) and CCR2 (E2917.39A) measured by Glosensor assay. Data are shown as means ± SEM; n = 3 independent experiments, performed with single replicates. f–h Close-up views of the conserved PIF (f), NPxxY (g), and DRY (h) motifs showing conformational changes along the pathway of receptor activation. Hydrogen bonds are depicted as black dashed lines.

