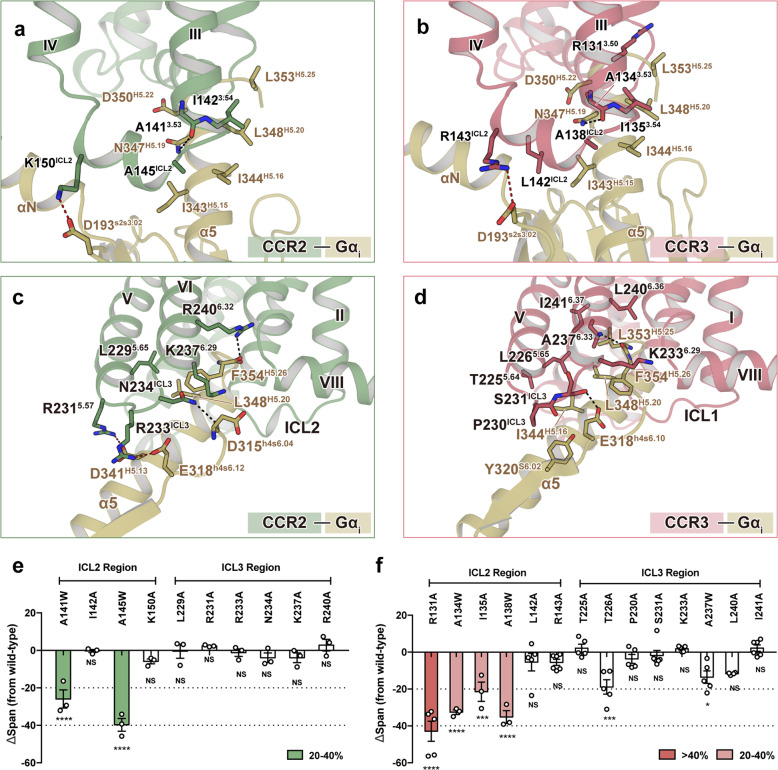
Fig. 4. Interactions between chemokine receptors and Gαi1.
a, b Magnified view of the interactions between TM3 and ICL2 of CCR2 (a) and CCR3 (b) with the α5-helix of Gαi. c, d Detailed interactions of TM5, TM6, and ICL3 of CCR2 (c) and CCR3 (d) with the α5-helix of Gαi. Green, CCL2-bound CCR2; pink, CCR3; yellow, Gαi1. Hydrogen bonds are depicted as black dashed lines, and electrostatic bonds are depicted as red dashed lines. e, f Influence of single-site mutants of CCR2 (e) and CCR3 (f) on agonist-induced cAMP accumulation. n = at least three independent experiments performed with single replicates. The statistical difference between wild-type and mutated receptor was calculated by one-way ANOVA followed by Dunnett’s multiple comparisons test. Superscripts indicate statistically significant difference (*P < 0.01, ***P < 0.001, ****P < 0.0001; NS no significance). Bars are colored according to the extent of effect. All data are shown as means ± SEM. See Supplementary Tables S5 and S6 for detailed statistical evaluation.

