Fig. 7.
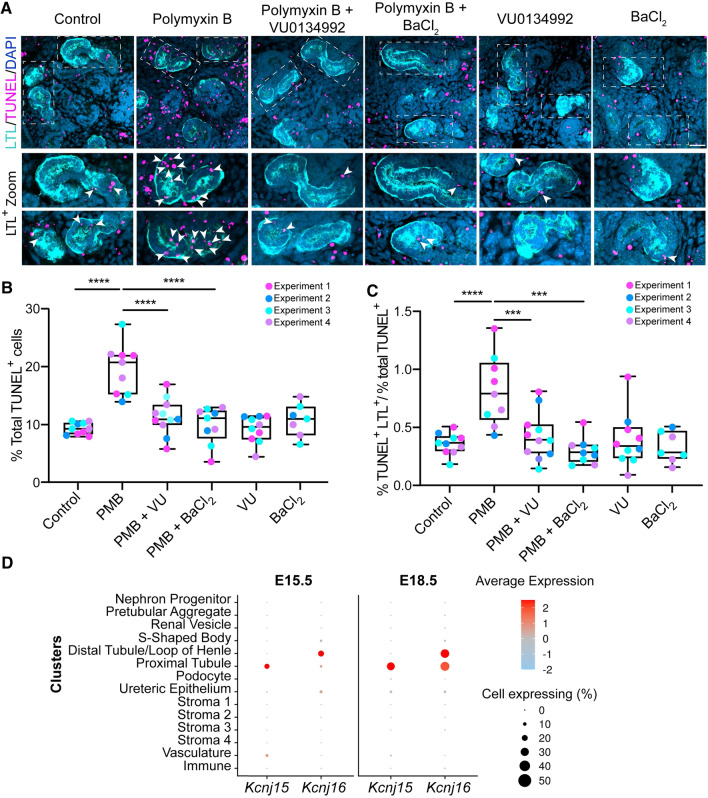
Polymyxin-induced toxicity in mouse kidney explant cultures with or without Kir inhibitors. A TUNEL staining (magenta) of explanted kidneys labelled with LTL (proximal tubules, cyan) and DAPI (nuclei, blue) after treatments with 50 μM polymyxin B (PMB), 5 μM VU0134992 (VU) and 50 μM BaCl2 alone or in combination. Scale bar = 30 μm. Dashed boxes in the top image panel indicate magnified proximal tubule regions shown below. TUNEL+ LTL+ cells are marked with arrowheads. B Quantification of polymyxin-induced apoptotic cells relative to the total number of cells in each sample (n = 4). ****p < 0.0001. C Assessment of relative levels of polymyxin-induced apoptosis in tubules with or without polymyxin treatment (n = 4). ***p < 0.001. D Expression levels of Kcnj15 and Kcnj16 in mouse developmental kidneys on embryonic day E15.5 and E18.5. Average gene expression levels (blue-red) and the percentage of cells within a cluster that expressed the gene (circle size) are displayed according to the legends

