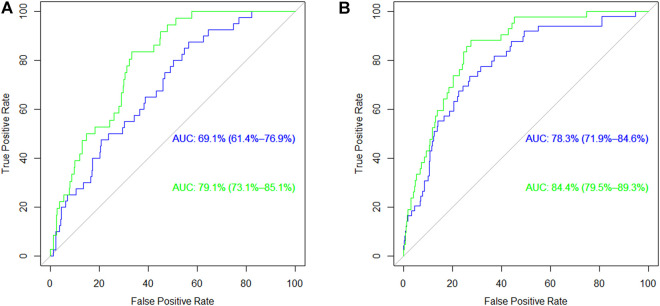
FIGURE 3.
Receiving Operating Curves for the risk of cardiovascular events in (A) nephrosclerosis patients and (B) the whole population of patients and controls. The blue line corresponds to the model with classic risk factors and the green line corresponds to the same model when genetic information is added. AUC, area under the curve.

