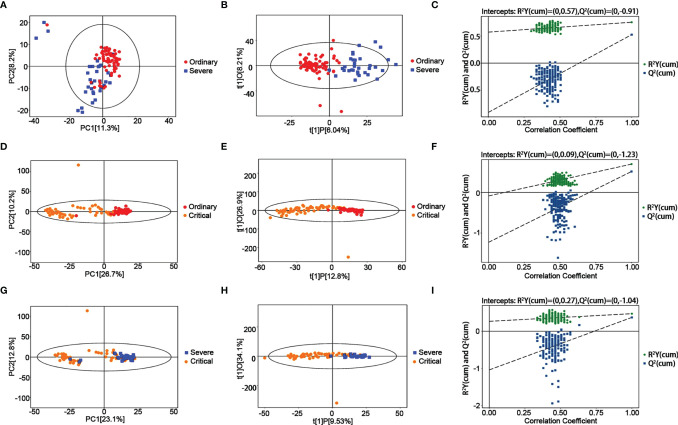
Figure 3.
Metabolomic alternations between the severe group and ordinary group as COVID-19 progresses. (A) PCA analysis. (B) OPLS-DA analysis. (C) Permutation analysis. Metabolomic alternations between the critical group and ordinary group. (D) PCA analysis. (E) OPLS-DA analysis. (F) Permutation analysis. Metabolomic alternations between the critical group and severe group. (G) PCA analysis. (H) OPLS-DA analysis. (I) Permutation analysis.

