Figure 4.
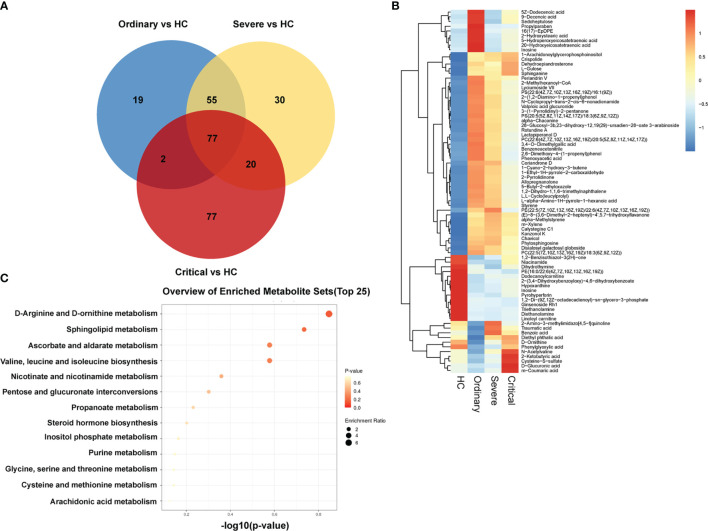
Massive differences of metabolism in sera of COVID-19 patients. (A) Venn diagram of negative and positive ion differential metabolites in the ordinary group, severe group, and critical group compared with healthy control. The number of differential metabolites is shown in each section. (B) Heat plot of the hierarchical clustering of differential metabolites. (C) Scatter plot of 13 differential metabolites with the most significant enrichment. p-value is plotted in a color map.

