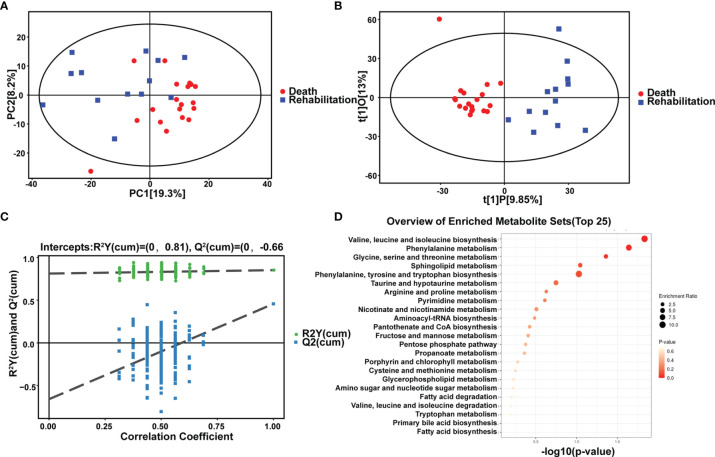
Figure 5.
Comparison of metabolic differences between rehabilitation and death. Metabolomic alternations and comparison of metabolic differences between rehabilitation and death in the critical group. (A) PCA analysis. (B) OPLS-DA analysis. (C) Permutation analysis. (D) Scatter plot of 13 differential metabolites with the most significant enrichment. p-value is plotted in a color map.

