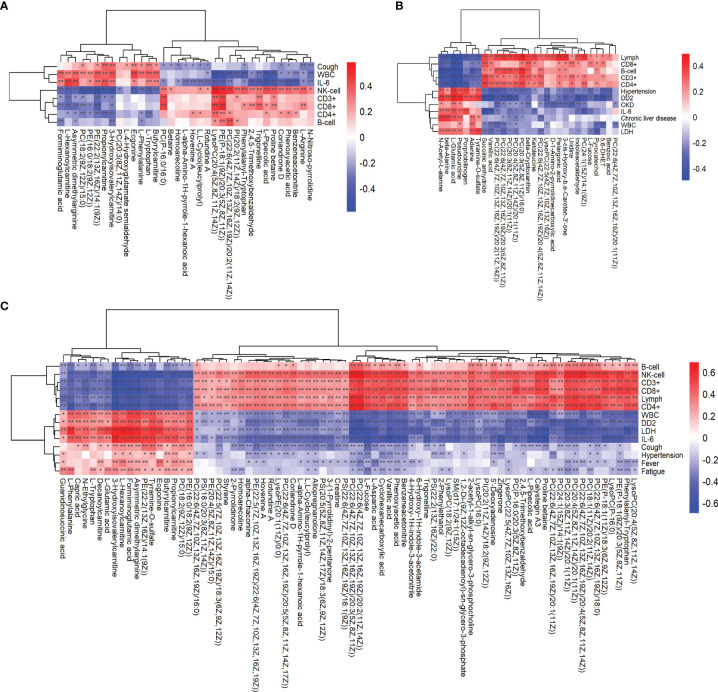
Figure 6.
Association analysis of clinical data with metabolomics analysis. Heat plot of the hierarchical clustering of differential metabolites between (A) the critical group and severe group, (B) severe group and ordinary group, and (C) critical group and ordinary group. p-value is plotted in a color map. Data were analyzed by unpaired two-sided Welch's t test. *p < 0.05; **p < 0.01.

