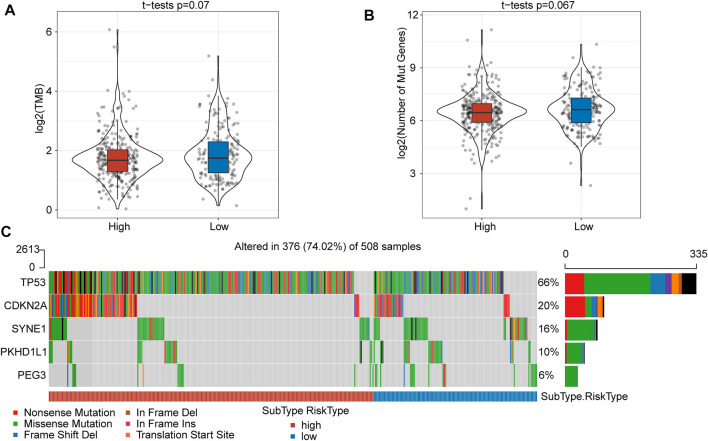
FIGURE 3.
The TMB and somatic mutation information between high- and low-risk score subgroups. (A) TMB score between the high- and low-risk subgroups showed no significant difference. (B) The number of mutated genes between the high- and low-risk subgroups was not significantly different. (C) Mutation characteristics of significantly mutated genes in the subgroups.

