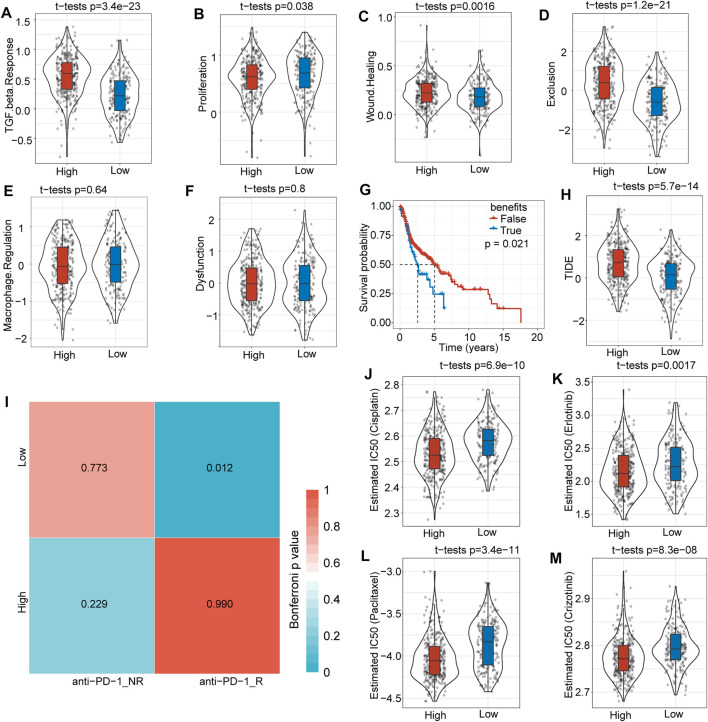
FIGURE 7.
Differences in immunotherapy and clinical efficiency. (A) The TGF-β response was much higher in the high-risk score group than in the low-risk score group. (B) The proliferation score was slightly higher in the high-risk score subgroup. (C) There was no significant difference in macrophage regulation between the two subgroups. (D) The wound healing score was higher in the high-risk score subgroup. (E) Overall survival time prediction between true and false immunotherapies based on TIDE analysis tools. (F) The TIDE score was significantly higher in the high-risk score subgroup. (G) The dysfunction score was not significantly different between the two subgroups. (H) The exclusion score was much higher in the high-risk score subgroup. (I) Low-risk score subgroup patients might be more sensitive to anti-PD1 immunotherapy. (J) Box plots of the estimated IC50 for cisplatin showed that the high-risk score subgroup had a lower IC50 level. (K) Box plots of the estimated IC50 for erlotinib showed that the high-risk score subgroup had a lower IC50 level. (L) The box plots of estimated IC50 for paclitaxel showed that the high risk score subgroup had a lower IC50 level. (M) Box plots of the estimated IC50 for crizotinib showed that the high-risk score subgroup had a lower IC50 level.

