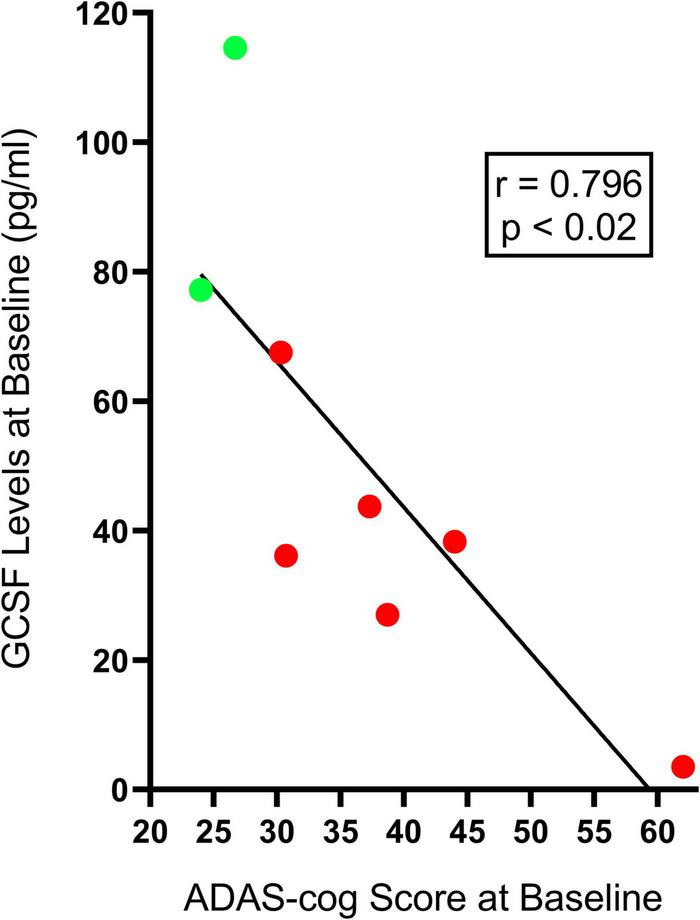
FIGURE 2.

The significant inverse correlation between plasma baseline GCSF levels and baseline ADAS-cog scores in individual AD subjects. Lower baseline GCSF levels were evident in individual AD subjects having poorer (higher) baseline ADAS-cog scores (Group 1, red-filled circles), while higher baseline GCSF levels were found in individual AD subjects with better (lower) baseline ADAS-cog scores (Group 2, green-filled points). This inverse correlation was present for seven of the eight cytokines measures in plasma.
