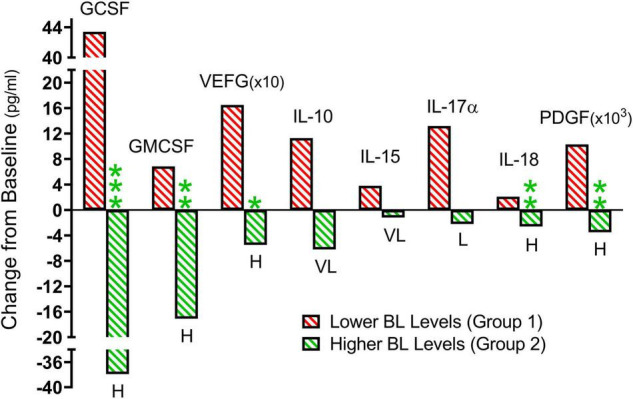
FIGURE 5.

From the individual subject results presented in Figure 3, summarized means of TEMT-induced changes for Group 1 (red; lower baseline levels) and Group 2 (green; higher baseline levels). When comparing Group 1 to Group 2, the direction of plasma cytokine response to 2 months of TEMT is universally opposite for all eight cytokines. The difference is frequently significant (p-value) and there is a substantial Effect Size (clinically important effect) for all eight cytokines. For Group 1 vs. Group 2 significance: *p < 0.05, **p < 0.02, ***p < 0.001. For Group 1 vs. Group 2 Effect Size: L, large; VL, very large; H, huge.
