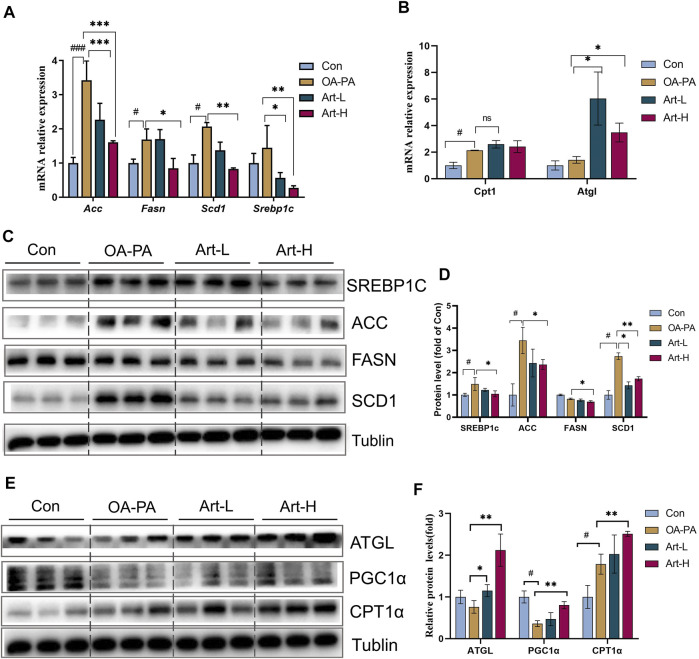
FIGURE 5.
Artemether improves lipid metabolism induced by oleic and palmitic acids in HepG2 cells. (A,B) Real-time PCR analysis of lipid synthesis-related genes (A) and lipolysis-related genes (B) in the HepG2 cells. (C) Western blot was used to detect the expression of lipid synthesis-related proteins in HepG2 cells. (D) Quantitative plots of the protein expression associated with lipid synthesis. (E) Western blot detected the expression of lipolytic protein in HepG2 cells (n = 3). (F) Quantitative plots of lipid breakdown-related protein expression. Con vs. OA-PA: # p < 0.05, ## p < 0.01, and ### p < 0.001. OA-PA vs. Art-L and Art-H: *p < 0.05, **p < 0.01, and ***p < 0.001.

